Handling Your Reports
Updating Reports
When a report is not up to date, a message (at the top of the report) specifies the date of the latest generation of the report as well the time required for generation. If the data contained in the list of objects changes, you must refresh the report to take these changes into account.
To update the report:
1. Access the report.
2. In the report title, click Refresh  .
.
.The report is updated.
Getting the List of Objects in a Data Series
To get the list of objects making up part of the chart:
1. Access the report.
2. Click the chart part concerned.
 .
.The list of objects contained in this part is displayed in the Results window.
In the list, you can click:
• Properties  , to view the properties of an element in the series.
, to view the properties of an element in the series.• Excel  to export the elements of the series in .xlsx format.
to export the elements of the series in .xlsx format.• Instant Report  , to generate an instant report for the series.
, to generate an instant report for the series.Hiding a Data Series
For improved visibility, you can hide data series in the report graphic.
To show/hide a data series:
1. Access the report.
2. In the report legend, click the data series concerned.
In the legend, the color that represents the series is grayed.
The series is not display anymore in the chart.
Example: in the chart that displays the breakdown of applications according to their current state, you can hide the series "[empty]" that represents the applications whose state is not entered.

3. In the legend, click the series again to re-display it in the chart.
Zooming in on a Chart Part (bar / linear / radar chart)
For improved readability, you can zoom in on a chart part.
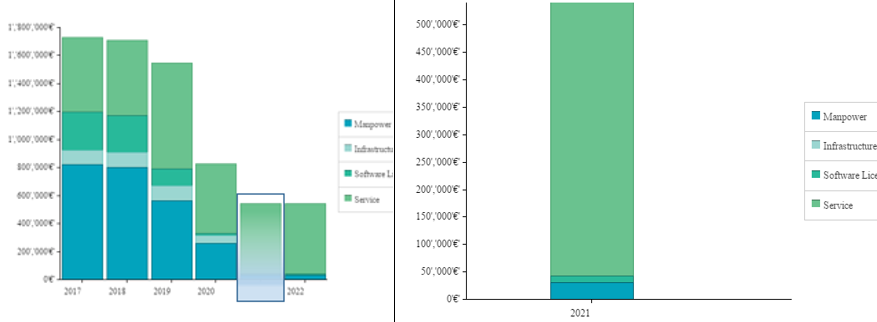
To zoom on a part of a chart:
1. Access the report concerned.
2. In the chart, with the mouse, select the part on which you want to zoom.
The selected part is automatically zoomed.
 or double-click in the chart.