Handling a Bubble Chart
In a bubble chart, you can:
• display, hide or reduce the length of labels to lighten the chart
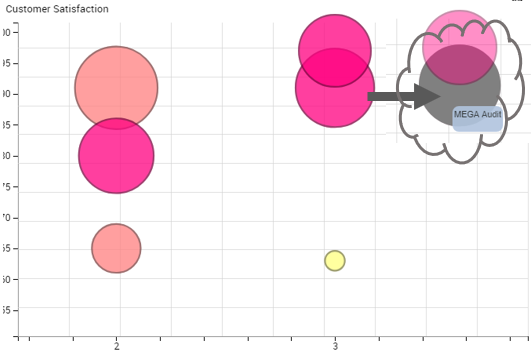
• display and highlight a bubble label
• display the link between each bubble and its label
• add a background image
• zoom in on and move about in the chart
• get the list of objects included in a bubble
Improving a bubble chart readability
To improve a bubble chart readability:
1. Access the bubble chart.

2. (If needed) Zoom in on and move about in the chart.

3. Modify the label style to display/hide the labels and their links.
4. (Instant Report) To quickly show/hide labels: below the chart, select Options, then select/clear Display Labels.
You can also move the Label Length cursor to reduce the length of the text of the labels.
5. (If needed) Add a background image
6. Roll the mouse over a bubble to highlight its label.
Zooming in on and moving about in a bubble chart
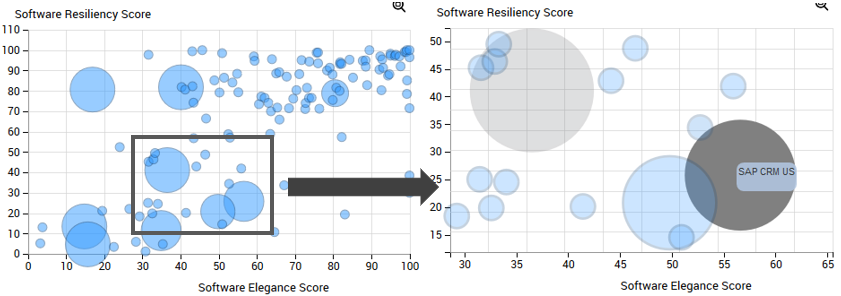
To zoom in on and move about in a bubble chart:
1. In the bubble chart, use the mouse wheel to zoom in/zoom out.
The zoom is performed on the graph as a whole.
2. (if necessary) To move about within the chart, click the chart, keep the mouse button pressed and move the mouse.