Customizing the Display of a Report Graphic
You can customize a graphic in your report at the following levels:
• chapter content
• chapter graphic style
• chapter series style level
• chapter style level, for exporting
You can reset the values configured by default at:
• parameter level
• entire chapter level
You can add comments at:
• report level
• report chapter level
Updating the content of a graphic of a report chapter
You can, for example:
• reverse the display of the series
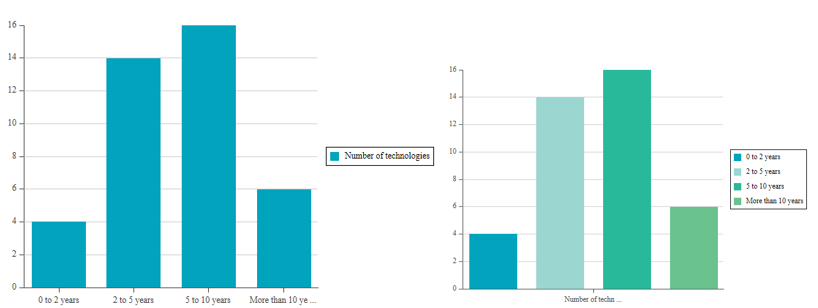
• show/hide the values (values or percentage) in the bars.
• add a title on the horizontal and/or vertical axis
To modify the report content:
1. Edit the report.
2. In the report page, click Edit style parameter values  and select All Series.
and select All Series.The edit pane appears.
3. In the Content section, modify the parameters concerned.
 . Attention: the style parameter values in the report chapter are also reset.
4. Click Apply.
Your modifications are immediately taken into account in the report.
 or see Expanding a Report Chapter Automatically on Opening.
Updating the font of a graphic of a report chapter
You can, for example:
• modify the color and the size of the font
• add a title to the graphic
To update the font of a graphic of a report chapter
1. Edit the report.
2. In the report page, click Edit style parameter values  and select All Series.
and select All Series.The edit pane appears to the right.
3. In the Style section, modify the parameters concerned.
. Attention: all parameter values in the report are also reset.4. Click Apply.
Your modifications are immediately taken into account in the report.
 or see Expanding a Report Chapter Automatically on Opening.
Modifying the bubble style in a bubble chart
You can, for example:
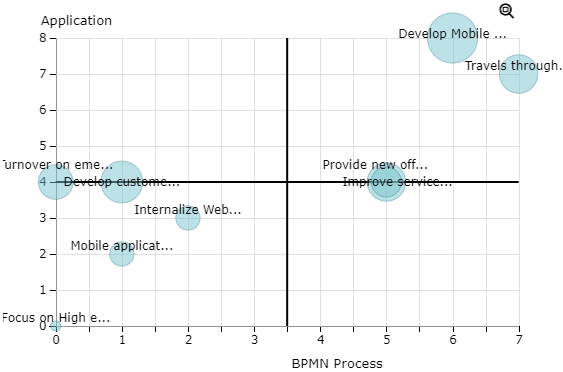
• display median axes
• modify the bubble color
• modify the bubble opacity
By default: 50, to increase the opacity set a value higher than 50, to decrease the opacity, set a value lower than 50.

• modify the bubble text font
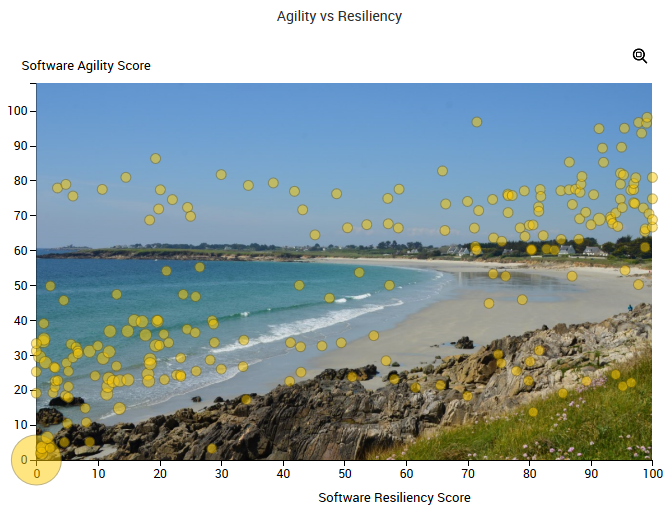
• add a background image (.png format)
You can add an image (in .png format), which is saved in HOPEX.
To modify the bubble style in a bubble graph:
1. Edit the report.
2. In the report page, click Edit style parameter values  and select All Series.
and select All Series.The edit pane appears to the right.
3. In the Style section, modify the parameters concerned.
. Attention: all parameter values in the report are also reset.4. Click Apply.
Your modifications are immediately taken into account in the report.
 .
.Modifying an object style in a graph
To highlight an object, you can modify for example:
• the border (color, thickness, style) of the object
• the fill color of the object
• the label color of the object
• the size of the object
To modify the size of an object:
1. Edit the report.
2. In the report page, click Edit style parameter values  and select an object.
and select an object.The edit pane of the object appears to the right.
3. In the Style section, modify the object style.
4. In the Labels Style section, modify the label color.
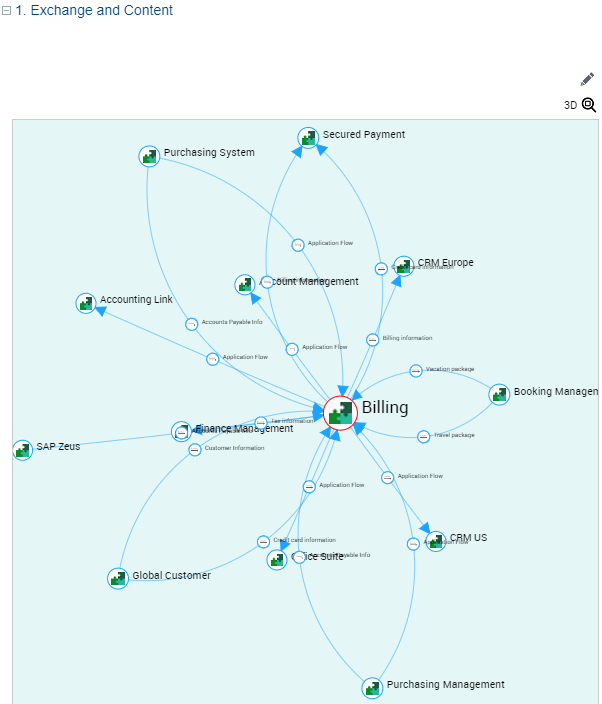
Updating the style of a graph of a report chapter
You can, for example:
• define fixed size nodes
• not color entry points
• define a background color to the graph
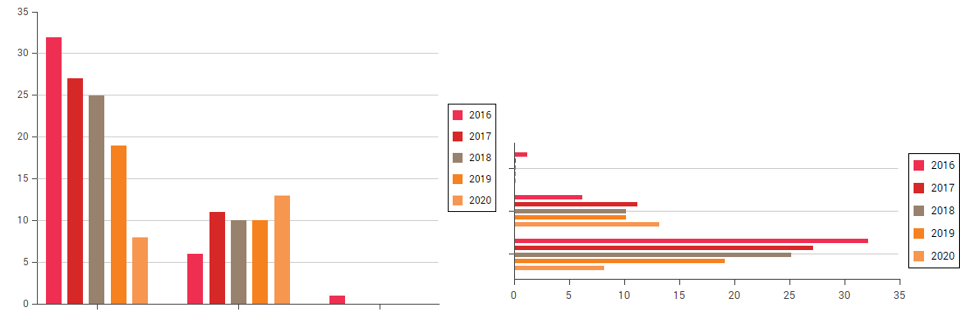
Updating the style of a graphic of a report chapter
You can, for example:
• modify the color palette of the series
• add a horizontal and/or vertical grid
• add a horizontal and/or vertical grid spacing
• stack the bars
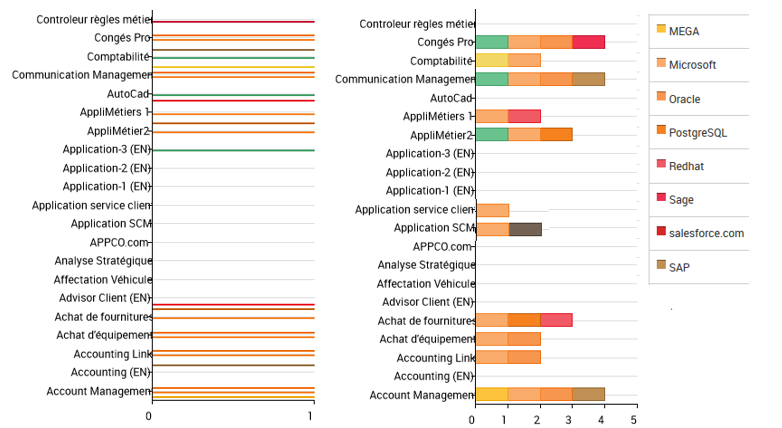
• reverse the bar direction (vertical or horizontal)
To modify the style of a report chapter:
1. Edit the report.
2. In the report page, click Edit style parameter values  and select All Series.
and select All Series.The edit pane appears to the right.
3. In the Chart Style section, modify the parameters concerned.
. Attention: all parameter values in the report are also reset.4. Click Apply.
Your modifications are immediately taken into account in the report.
 or see Expanding a Report Chapter Automatically on Opening.
Modifying the style of labels
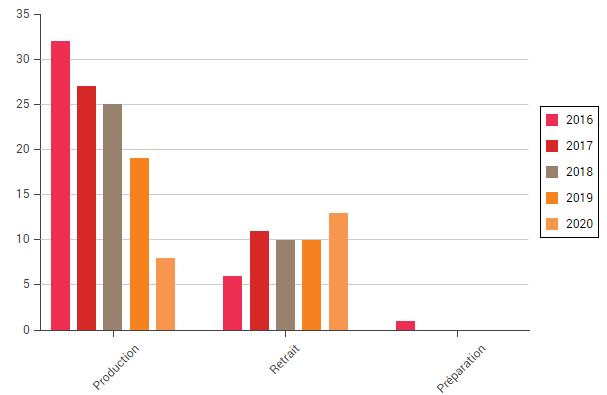
You can, for example:
• hide the axes
• define the maximum value of axes
• truncate the labels
• reverse the label order
• sort by value order (vertical axis)
• define a display angle for the horizontal label (in degrees)
To modify the style of the labels of a report chapter:
1. Edit the report.
2. In the report page, click Edit style parameter values  and select All Series.
and select All Series.The edit pane appears to the right.
3. In the Labels Style section, modify the parameters concerned.
. Attention: all parameter values in the report are also reset.4. Click Apply.
Your modifications are immediately taken into account in the report.
 or see Expanding a Report Chapter Automatically on Opening.
Modifying the legend style
You can, for example:
• hide/show the legend
• modify the position of the legend (on the bottom or right)
• hide/show the legend frame
To modify the legend style of a report chapter:
1. Edit the report.
2. In the report page, click Edit style parameter values and select All Series.
and select All Series.The edit pane appears to the right.
3. In the Legend Style section, modify the parameters concerned.
. Attention: all parameter values in the report are also reset.4. Click Apply.
Your modifications are immediately taken into account in the report.
 or modify the configuration (see Expanding a Report Chapter Automatically on Opening).
Modifying the style of parameters in a report chapter
You can:
• (for a bar chart) modify the display style (as bars or as lines)
• modify the series color
To modify the parameter style of a series in a report chapter:
1. Edit the report.
2. In the report page, click Edit the Style Parameters Values and select the series that you want to modify.
and select the series that you want to modify.The edit pane of the selected series appears to the right.
3. In the pane of the selected series, in the Graphic Style section, select the parameter values of the series that you want to modify.
4. Click Apply.
Modifying the style for export
You can:
• define the maximum value of axes
• display a percentage in the bars.
To modify the style of a report chapter for export:
1. Edit the report.
2. In the report page, click Edit style parameter values  and select All Series.
and select All Series.The edit pane appears to the right.
3. In the Style for Export section, enter the required fields.
4. Click Apply.