Handling a Dendrogram
A dendrogram illustrates the environment of an object. You can improve its display:
• in the report parameters:
• modify its display Display mode (circular or horizontal)
• modify the Number of displayed levels by default
• in the dendrogram:
• display an additional level of a single branch
• modify the depth of display of a branch levels from a specific object
Example of a Report Template showing a dendrogram:
“Environment report”
With Display and Number of displayed levels parameters, this Report Template also includes the following parameters:
Subject: defines the source object of the dendrogram.
Hierarchy: defines the link (via a MetaAssociationEnd or a query) browsed recursively to display the objects.
Deepness: defines the number of displayable levels of a branch.
Improving a dendrogram readability
To improve a dendrogram readability:
1. (If needed) Zoom in on and move about in the dendrogram.
2. Edit the report (click More  > Edit Report
  ).
).
> Edit Report ).3. In the edit pane, Styles section, modify the style parameters, then click Apply.
Select, for example:
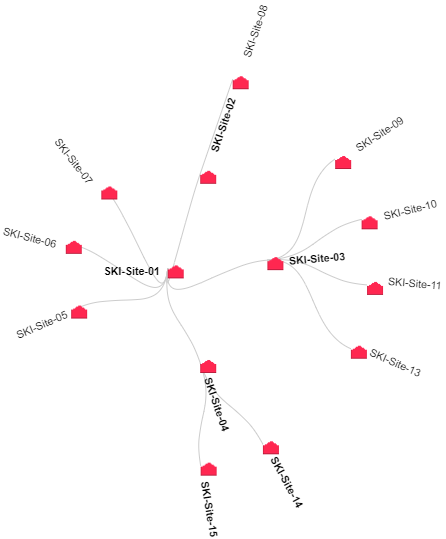
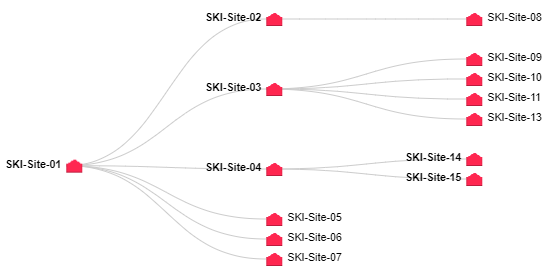
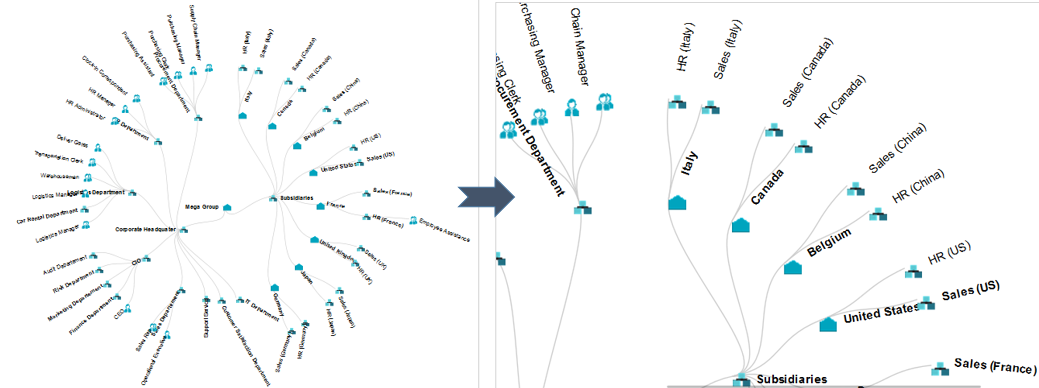
• the most suitable Display mode
Circular
Horizontal
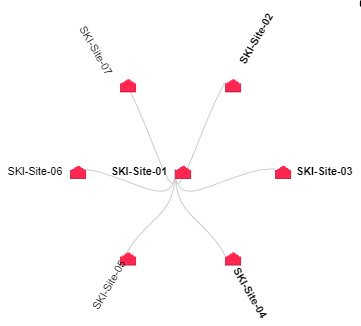
• the default Number of displayed levels for all of the branches
Example: 2 levels displayed by default
4. Click an object:
• at the end of a branch to display an additional level (objects with bold names have additional levels)
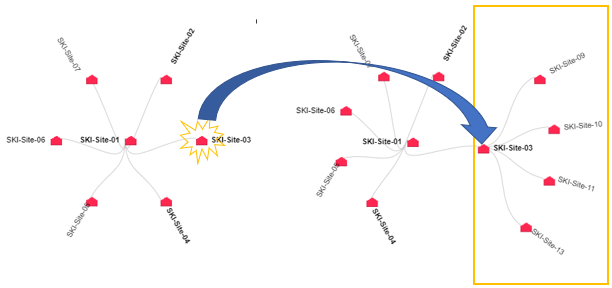
• within a branch to hide the deeper levels
Zooming in on and moving about in a dendrogram
To zoom in on and move about in a dendrogram:
1. Access the environment type report concerned.
2. In the dendrogram, use the mouse wheel to zoom in/zoom out.
The zoom is performed on the dendrogram as a whole.
3. (if necessary) To move about within the chart, click the chart, keep the mouse button pressed and move the mouse.