Handling a Breakdown Report
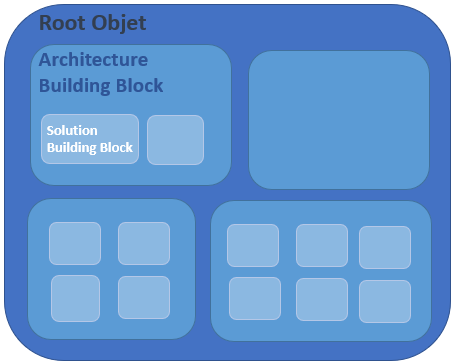
A breakdown report can be specialized according to each Solution specific needs. This type of report enables to display the breakdown of an “Architecture Building Block” type root object (e.g.: Capability map) into sub-objects of different types and analyze their fulfillment by “Solution Building Block” type objects (e.g.: Application).
The Report Template showing a breakdown map is based on:
• a root object
• analysis criteria (on each breakdown level)
You can:
• modify the number of levels displayed in the report
• modify the analysis criteria displayed (background color and forms)
• unfold all of the elements
• highlight a criterion (e.g.: attribute or rating)
• filter the elements of a breakdown level using a predefined query
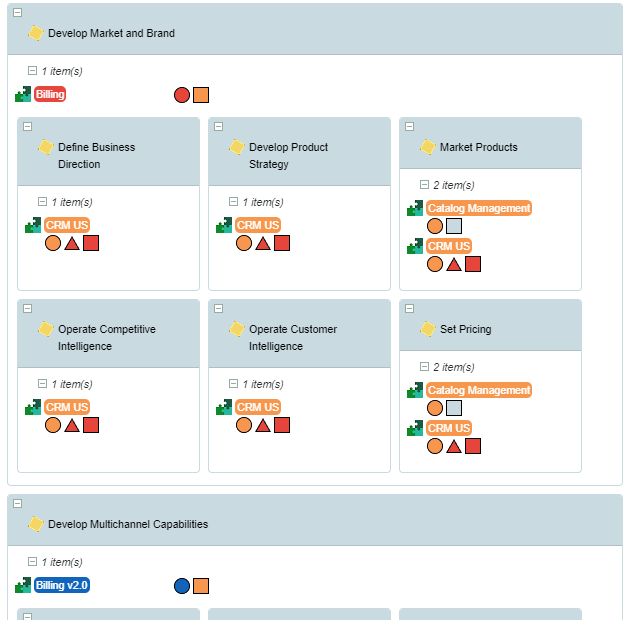
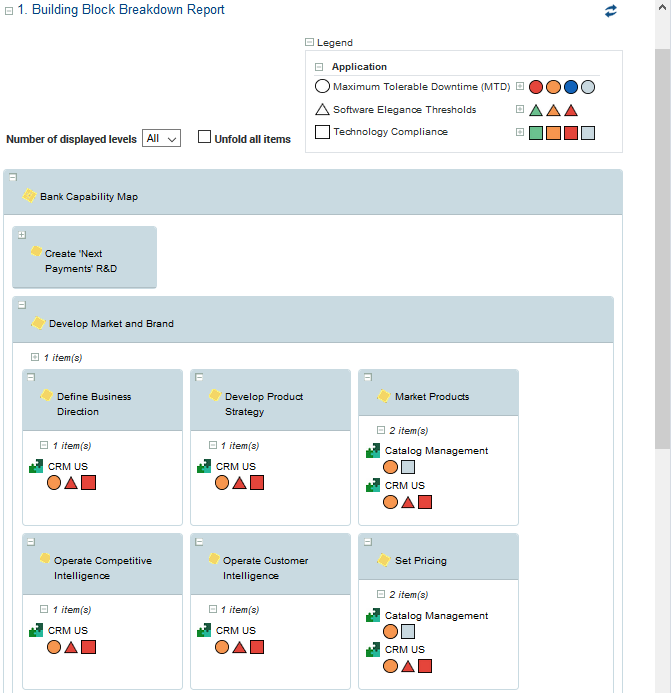
Example of a Report Template showing a breakdown map
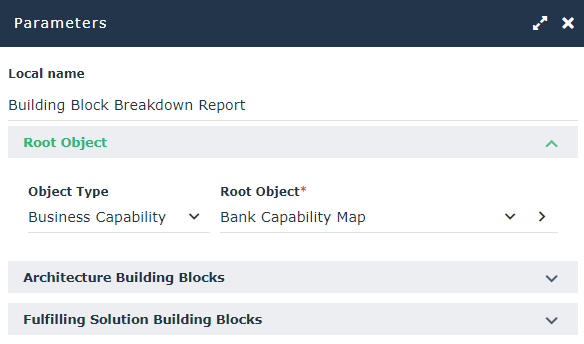
The “Building Block Breakdown Report” shows a breakdown map.
The “Building Block Breakdown Report” details the breakdown of a Root Object (e.g.: the "Bank Capability Map” Business Capability Map) according to selected classifier objects:
• Architecture Building Blocks
Example: Capability Models.
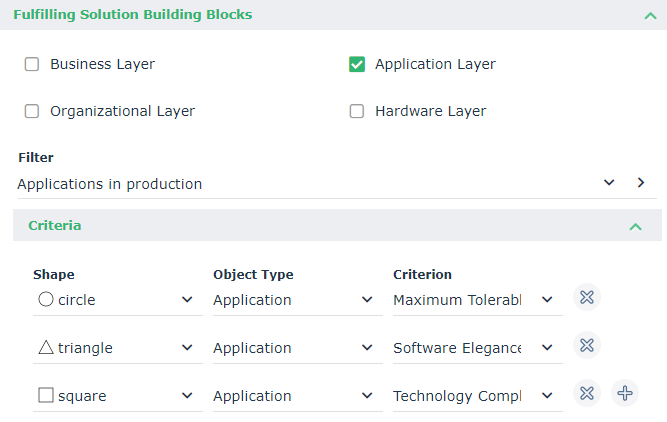
• Fulfilling Solution Building Blocks
Example: Application layer.
For each building block, you can add:
• a content filter (using a query)
Examples:
The “Capabilities with fulfilling solutions building blocks” filter, which you can add to the Architecture Building Blocks, enables to display only capabilities fulfilled by applications (Solution building blocks).
The “Applications in production” filter, which you can add to the Fulfilling Solution Building Blocks, enables to display only the applications that are in production
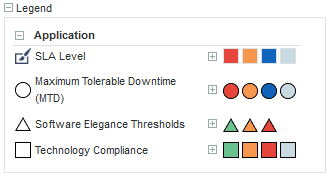
• analysis criteria and choose their associated symbols (forms)
Examples:
The “Maximum Tolerable Downtime(MTD)” criterion of an application is represented by a circle.
The “Software Elegance Thresholds” of an application is represented by a triangle.
The “Technology Compliance” is represented by a square.
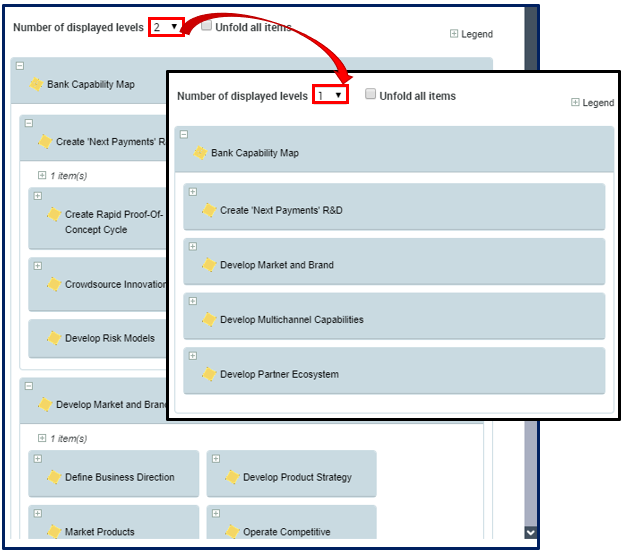
To configure a breakdown map display:
1. To lighten a breakdown map display, in the Number of displayed levels field, select an upper level.
Lower levels are hidden.
2. To display the criteria values in the legend, click  next to each criterion.
next to each criterion.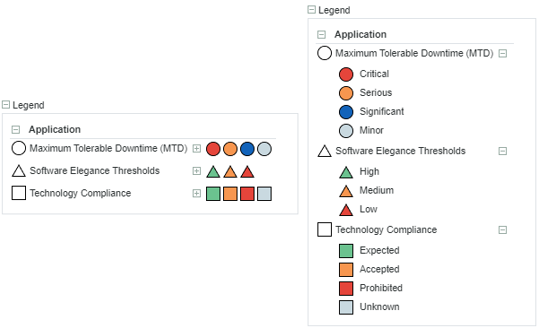
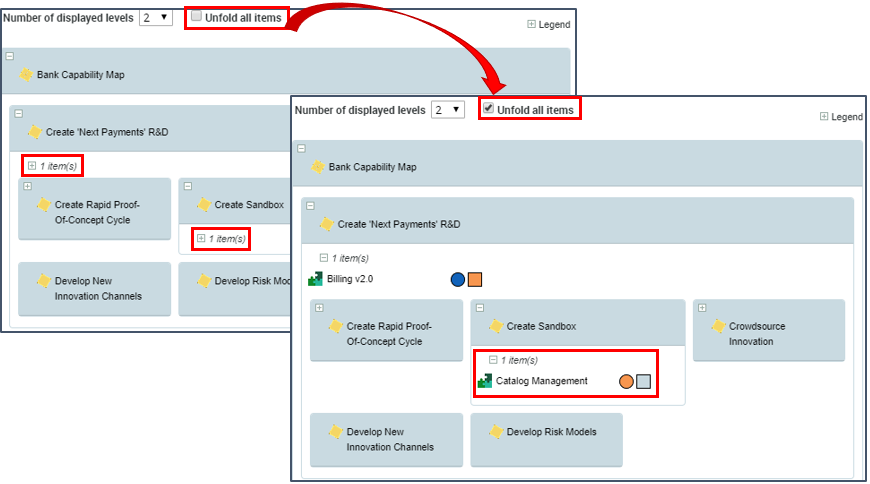
3. To unfold all items, select Unfold all items.
Displayed items are unfolded.
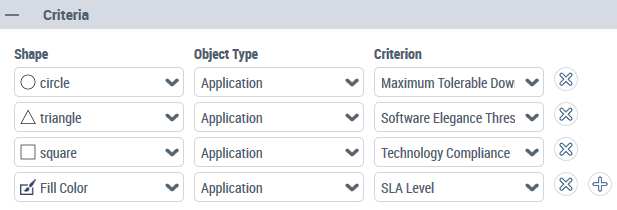
4. To add an analysis criterion: in the Parameter page of the report properties, Criteria section:
• Click Add Criterion  .
.
.• In the Shape column, select the symbol associated with the criterion, or select “Fill Color” to highlight this criterion (adding back ground color to the name of the object).
Example: Fill Color.
• In the Object Type column, select the type of object that holds the analysis criterion.
Example: Application.
• In the Criterion column, select the object parameter. The values of this parameter are represented by colors.
Example: SLA Level of the application.
• Click  to refresh the report:
to refresh the report:The parameter is added to the legend.
If you chose the “Fill color” shape, the name of the objects have as background color the color that represents the value of the criterion selected.
Example: The name of the applications has as background color the SLA level value of the application.