Launching an Instant Report
You can launch an instant report from:
• a list of objects
E.g.: a list available in a tile of your home page, in a search result, or in the result of an analysis report when the latter allows this.
• an object
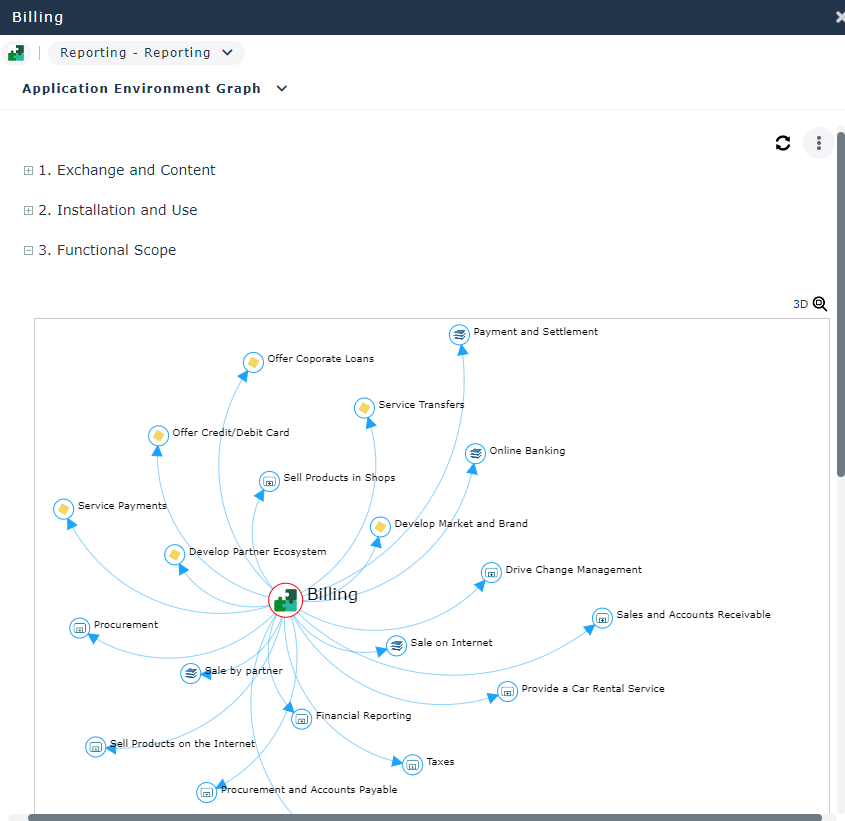
E.g.: the Application Environment Graph is available for an application.
• a Report DataSet
To launch and keep several instant reports in the edit zone, see Launching several instant reports.
Launching an instant report from a list
To launch an instant report from a list:
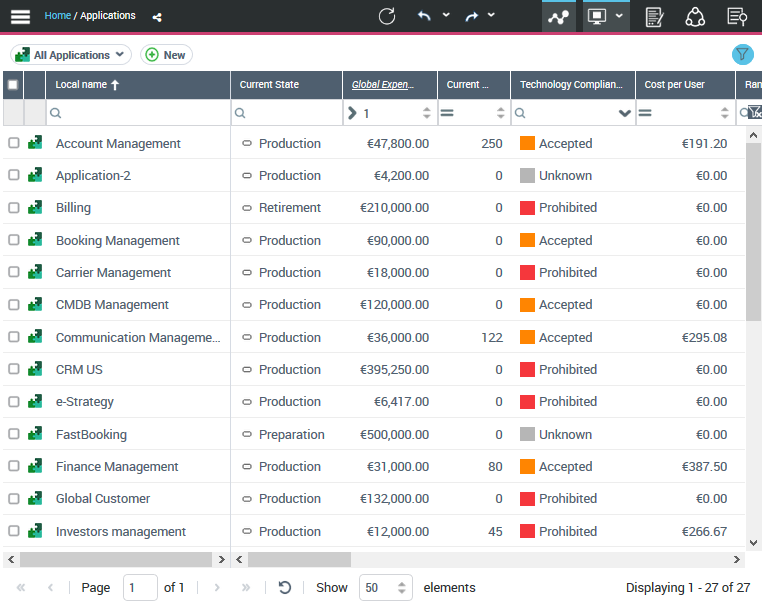
1. Display the relevant object list.
E.g.: in your home page, with the All applications tile, display the list of all applications.
2. (Optional) Filter the list on the objects you are interested in.
E.g.: applications with expenses > 1.
3. According to your needs:
• To launch the instant report on all of the objects in the list (all the pages): select the column header checkbox.
• To restrict the instant report to certain objects: select one or more objects.
4. Click Instant Report  .
.
. to access it.
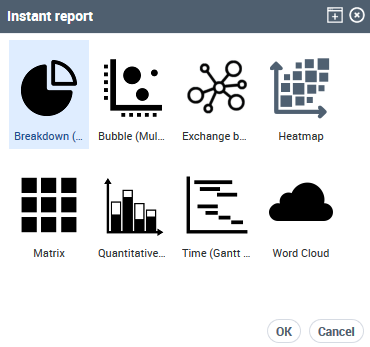
5. Select the required instant report type.
Example: breakdown (pie chart, bar chart)
6. Click OK.
The instant report is displayed in the View edit area.
7. Depending on the type of instant report selected, you can enter the instant report parameter information.
For example, for an instant report:
• of breakdown type, in the Group by field, select a grouping characteristic from the list.
• of quantitative type, select information to be taken into account in the graphic display.
Objects are automatically displayed according to the selected settings.
Example: "Current State".
For the set of selected applications, you get their breakdown according to their current state.
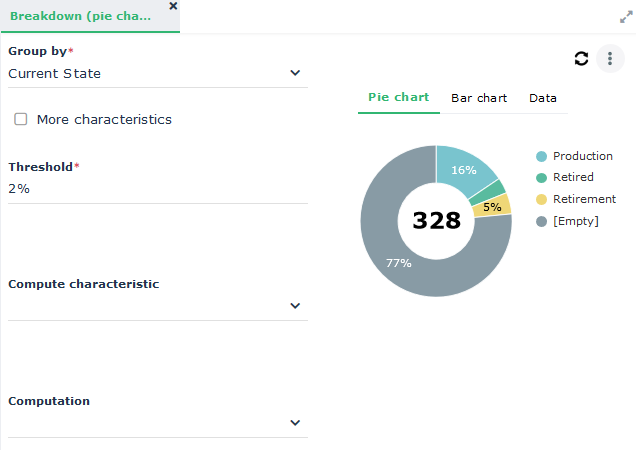
8. (if needed, for a breakdown type report) Select another type of breakdown display.
By default, the breakdown chart appears in the form of a pie chart; click on another type.
Example: Bar chart, Data.
9. (optional) If necessary, click in a part of the pie chart, in a bar of the bar chart or in a cell of the data table.
The list of objects contained in this part is displayed in the Results window.
Launching an instant report from an object
To launch an instant report from an object:
1. Access the object properties.
Example: from an object in a list or in a diagram.
2. Display the Reporting page.
3. In the drop-down menu, select the report.
E.g.: for an application, the Application Environment Graph.
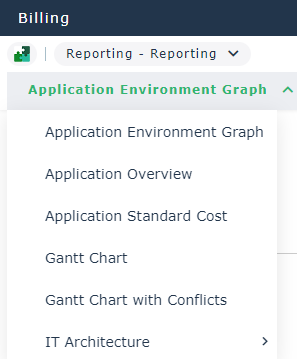
The instant report is displayed in the property pages.
Launching an instant report from a Report DataSet
To generate an instant report from a Report DataSet:
1. Access the Report DataSet properties.
2. Display the Data page.
3. (If needed) In the Parameters section, click Add and select the input parameters.
E.g.: with a Report DataSet with the "Application Technologies" definition, you can add applications.
4. In the Report DataSet section, click Refresh  .
.
.5. In the Report DataSet section, click Instant Report .
.6. Select the required instant report type.
Example: Table
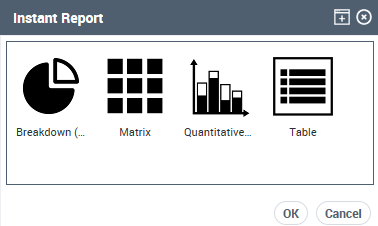
7. Click OK.
The instant report is displayed in the View edit area, Report section.
Example: If it is a table, it contains as many rows as objects and as many columns as object characteristics.
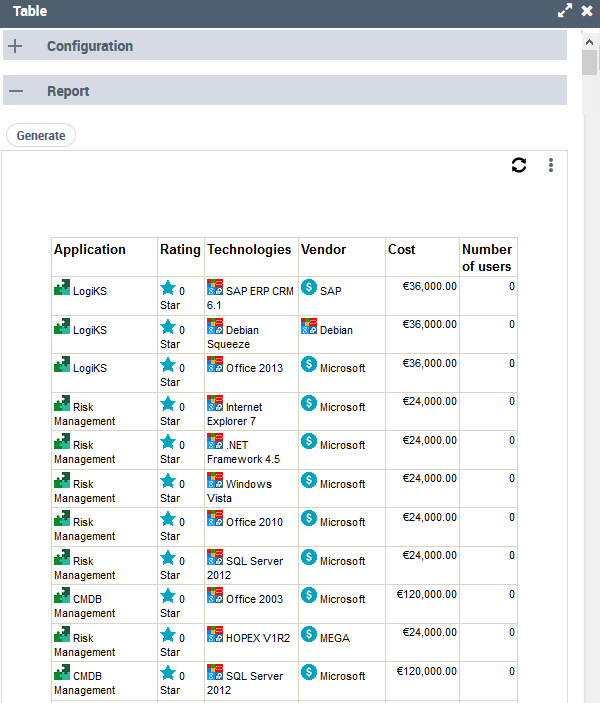
8. (Optional) You can customize the report display.
You can customize the table to obtain a more precise description of the result and facilitate the analysis. For this, in the Configuration section, add one or as many filters as necessary to the input characteristics of the report.
Launching several instant reports
To display more than one instant report in your View edit area, you must be in Multi-view  display mode before launching another instant report.
display mode before launching another instant report.In Single-view  display mode (by default), the next instant report replaces the current instant report.
display mode (by default), the next instant report replaces the current instant report.