Launching an Instant Report
You can launch an instant report from:
• a list of objects
Ex.: a list accessible via your homepage or the result of a search.
You can generate the instant report in the current page or in a new tab. So that you can keep, in parallel, several instant reports generated from this list or a subset of it (filtered list).
E.g.: from a list of applications.

• a Report DataSet
You can generate the instant report in the current page or in a new tab. That way you can keep, in parallel, several instant reports, generated from this Report DataSet.
E.g.: from a Report DataSet with “Application Technologies” definition, whose input parameters are applications.

• an object in a list
You can create a dendrogram type instant report from an object.
Launching an instant report from a list
You can launch the instant report on all of the objects of the list or refine the analysis to specific objects.
To launch an instant report from a list:
1. Display the relevant object list.
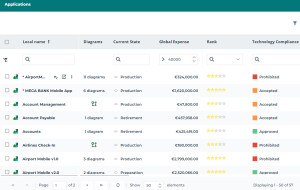
E.g.: in your home page, from the access link to the inventory of the Applications, display the list of all the applications.
2. (Optional) Filter the list on the objects you are interested in.
E.g.: applications with expenses > € 40,000.
3. According to your needs:
• To launch the instant report on all of the objects in the list (all the pages): select the column header check box.
• To restrict the instant report to certain objects: select one or more objects in the list.
• To restrict the instant report to a set of objects built through a filtering (or a query): filter, then select the whole list of object (select the column header check box).
E.g.: Filter the applications whose Global Expense exceeds €40,000.
4. Click Instant Report  .
.
. .
.
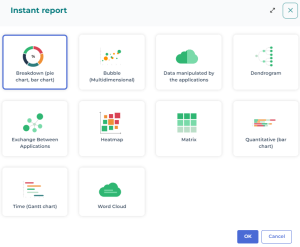
5. Select the required instant report type.
E.g.: breakdown (pie chart, bar chart)
6. Click OK.
The instant report is displayed in the current page (or in a new tab).
7. Depending on the instant report type selected, enter the instant report parameter information.
For example, for:
• a breakdown-type instant report, in the field Compute characteristic, select a characteristic from the list.
• a quantitative-type instant report, select information to be taken into account in the chart display.
• a dendrogram-type instant report, select the type of objects and their relationships to display in the dendrogram.
• a matrix-type instant report, select the type of objects to display in column and their relationships with the objects in row.
Objects are automatically displayed according to the selected settings.
E.g.: "Current State".
For the set of selected applications, you get their breakdown according to their current state.
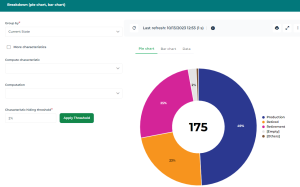
8. (if needed, with a breakdown type report) Select another type of breakdown display.
By default, the breakdown chart appears in the form of a pie chart; click on another type.
Example: Bar chart, Data.
9. You can:
• customize the instant report
• save the instant report to keep it.
Launching an instant report from a Report DataSet
To generate an instant report from a Report DataSet:
1. Access the Report DataSet properties.
2. Display its Data page.
3. (If needed) In the Parameters section, add input parameters.
E.g.: with a Report DataSet with the "Application Technologies" definition, you can add applications.
4. (If needed) In the Report DataSet section, click Generate  .
.
.5. In the Report DataSet section, click Instant Report .
..
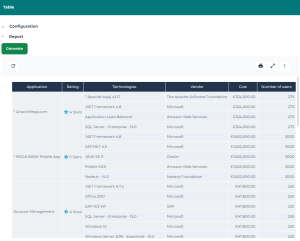
6. Select the required instant report type.
E.g.: Table
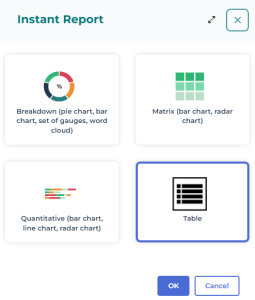
7. Click OK.
The instant report is displayed in the current page (or in a new tab).
E.g.: if it is a table, it contains as many rows as objects and as many columns as object characteristics.
8. (If needed) You can:
• customize the report display.
E.g.: You can customize the table to get a more precise description of the result and facilitate the analysis. For this, in the Configuration section, add one or as many filters as necessary to the input characteristics of the report.
• display icons in the table
• access the properties of the objects contained in the table cells (and modify them)
• save the report