Managing a Table Instant Report data (Report DataSet)
To obtain a more detailed description, improve the table and facilitate its analysis, in the Configuration section you can:
• define the input characteristics of the report, that is, the table columns (Configuration tab),
• add filters to the data values, that is, the cells of the table columns (Filters tab).
You can add as many configurations as necessary to the input characteristics of the report and their values.
You can add filters to the table columns and cells.
Defining the columns in a table-type instant report
By default, the instant report includes all of the Report DataSet columns. You can modify its content and define the table columns and their position.
On columns, you can:
• display (/hide) one or more columns:
• modify the default column sort (order and priority):
• By default, all of the columns are sorted by ascending order.
• By default, column sort priorities are defined as the column display order at Report DataSet creation.
• modify the display order of columns
On rows, you can:
• (by default rows are grouped) add breaks to the table
• add information to the break:
• define the column considered by the information
• define the information calculation
• define a calculation performed on cell values
• display only the first 50 rows of the table.
You can also display object icons.
To define the columns in a table-type instant report:
1. Launch the instant report on the Report DataSet.
The instant report is displayed in full page.
• The Configuration section displays all the possible columns of the table. It contains as many columns as object types and object characteristics.
• The Report section displays the table. It contains as many rows as objects and as many columns as object characteristics.
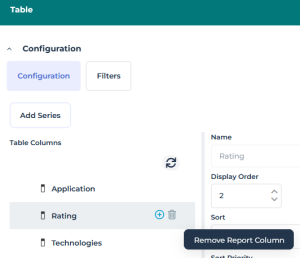
2. To hide the display of a column in the table, hover the mouse over the column name and click Remove Report Column  .
.
.Example 2: from a Report DataSet with the "Application Technologies" definition, delete the "Rating", "Technologies" and "Number of Users" columns.
3. (if needed) Modify the Display Order of columns, then click  to display this change in the Table Columns display too.
to display this change in the Table Columns display too.Example 2: drag-and-drop the "Application" column after the "Vendor" column.
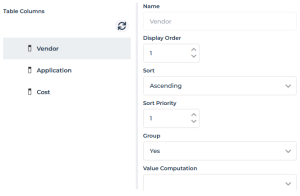
4. (if needed) Select a column and modify the default settings:
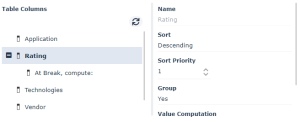
• Sort order of the selected column (“Ascending” by default).
Example 1: from a Report DataSet with the “Application Technologies” definition, “Rating” column: Sort field, select “Descending” to sort the applications by rating level, from the highest scored to the lowest scored.
Example 2: from a Report DataSet with the “Application Technologies” definition, “Vendor” column, Sort “Ascending”. Vendors are sorted in alphabetical order.
• Sort Priority of the selected column
• Group field, ("Yes", by default table rows are grouped according to the selected column).
Example 1: from a Report DataSet with the “Application Technologies” definition, “Rating” column, Group “yes”: applications are grouped according to their rating level.
Example 2: from a Report DataSet with the “Application Technologies” definition, “Vendor” column, Group “yes”: applications are grouped according to their vendor.
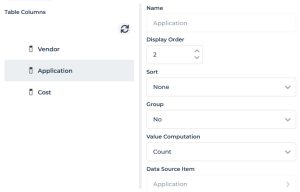
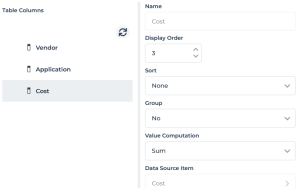
5. (optional) In the Value computation field, select the computation value to perform on the column cells.
Example 2: from a Report DataSet with the "Application Technologies" definition:
“Application” column: in the Value computation field, select “Count” to display the number of applications by “Vendor”,
“Cost” column: in the Value computation field, select “Sum” to display the sum of costs by "Vendor".
6. (optional) To highlight a grouping, you can add a break in the table: hover the mouse over the column name and click Add Break  .
.
.The break addition is specified below the column (At break, compute).
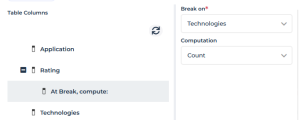
.7. (optional) To add an information in the break, select At break, compute and in the right pane define the computation to be performed.
• in the Break On field, select the column concerned by the computing.
• in the Computation field, select the computing operator.
Example 1: from a Report DataSet with the "Application Technologies" definition, for the grouping on the "Rating” column, at the break, in the Break On field select: "Technologies" and in the Computation field select: “Count" to display in the break the number of technologies contained in the grouping.

8. (Optional) Select Show icons to display object icons of rows and columns.
9. In the Report section, click Generate.
The report display takes the configuration applied into account.
Adding a filter to the columns and to the column data values in a table-type instant report
Filters are specific to the data type.
For example, the following filtering operators are available for a column whose cells are:
• numerical values: equals, inferior, superior, or shows a a value
• character strings: contains, starts with, ends with, contains a value
• Objects or multivalued attributes: choice of one or more objects (single or multiple choice), contains values
You can define as many filters as columns (characteristics) in the table.
To add a filter to the column cells in a table-type instant report:
1. Launch the instant report on the Report DataSet.
• The instant report is displayed in full page. It contains as many rows as objects and as many columns as object characteristics.
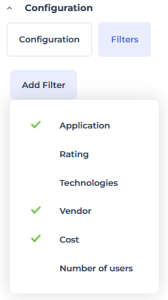
• In the Configuration section, the Filters tab is used to add a customized filter on each of the cells in the table.
2. Click Add Filter to add a filter.
The list of columns appears.
3. Select the column to which you want to add a filter.
Example 3: from a Report DataSet with the "Application Technologies" definition, select "Vendor" and repeat the operation for "Cost" and "Application".
4. In the right part of the filter, define the filtering.
The filtering definition depends on the type of data.
Example 3: from a Report DataSet with the "Application Technologies" definition for the column:
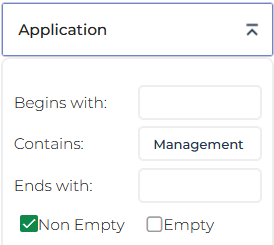
- “Application”, in the Filter choice field, select Contains.
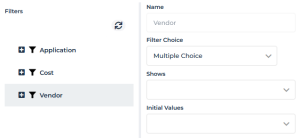
- "Vendor", in the Filter choice field, select "Multiple choice".
Adding a filter to the columns and to the column data values (with initial values) in a table-type instant report
You can define as many filters as columns in the table.
To add a filter to the column cells in a table-type instant report:
1. Launch the instant report on the Report DataSet.
• The instant report is displayed in full page. It contains as many rows as objects and as many columns as object characteristics.
• In the Configuration section, the Filters tab is used to add a customized filter on each of the cells in the table.
2. Click Add to add a filter.
The list of columns appears.
3. Select the column to which you want to add a filter with an initial value.
Example 4: from a Report DataSet with the "Application Technologies" definition, select "Vendor".
4. In the right part of the filter, define the filter with an initial value.
The filtering definition depends on the type of data.
Example 4: from a Report DataSet with the "Application Technologies" definition for the "Vendor" column:
- in the Filter choice field, select "Multiple choice".
- in the Initial values field, select the "Microsoft" and "Oracle" values.
5. Click Add to add a filter to another column.
Example 4: from a Report DataSet with the "Application Technologies" definition, select the column:
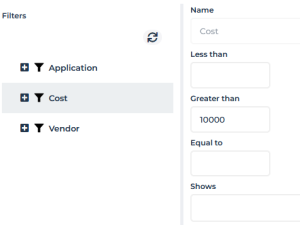
- "Cost", then in the Greater than field, enter "10000".
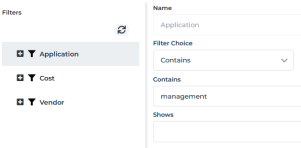
- "Application", in the Filter choice field, select "Contains", then in the Contains field, enter "management".
Example of column definition on a table
For example, in the instant report obtained from a Report DataSet with the "Application Technologies" definition you can configure the following columns:
• “Application"
• “Rating” (of the application)
• “Number of users” (of the application)
• “Cost” (of the application)
• “Technologies” (of the application)
• “Vendor” (of the technology)
You can also:
• hide columns
• modify the order of columns.
Example 1: column configuration with break
For example, in an instant report generated from a Report DataSet with the "Application Technologies" definition, you can:
• classify the applications by descending level of rating
• sort Rating by priority 1, then Application by priority 2
• keep the grouping and define an operation at a value break on this grouping criteria
• at the break level, indicate the number of Technologies included in this rating level.
This report result shows the applications sorted by descending level of rating. At each change of level, a break indicates the number of Technologies included in this rating level.
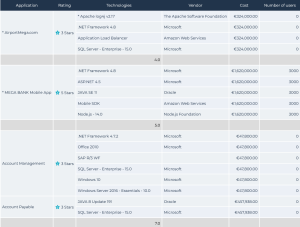
Example 2: column definition (display, order) and value computation
For example, in an instant report generated from a Report DataSet with the "Application Technologies" definition you can:
• hide the columns:
• Rating
• Technologies
• Number of users
• modify the display order of columns:
• column 1: Vendor
• column 2: Application
• column 3: Cost
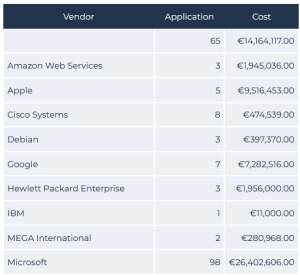
• sort in ascending order and group the table rows by "Vendor"
• instead of displaying all the "Applications" by "Vendor", display their number
• display the sum of "Costs" by "Vendor"
The report result presents the Vendors sorted in alphabetical order and specifies for each vendor the number of applications and their total cost.
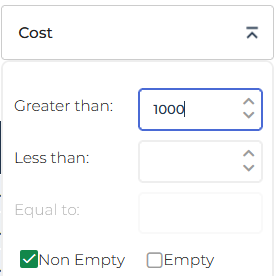
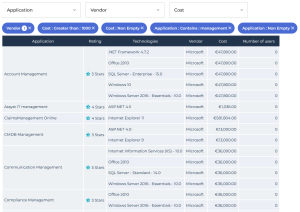
Example 3: filters on the table columns
For example, in an instant report generated from a Report DataSet with the "Application Technologies" definition you can:
• add a filter to each following table column:
• “Application"
• “Vendor"
• "Cost"
• define each filter added
The three filters are available in the report result:

To define a filter:
1. Click the name of the filter.
E.g.: Application
2. In the filter definition window, configure the filter.
The filter configuration is displayed above the table.
The report result is automatically updated as soon as a value is entered.
For example, you can display:
• the applications that contain "management" in their name,
• for the "Microsoft" vendor " (selected in the multiple-choice list),
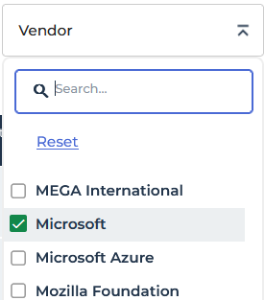
• and whose costs are greater than €1,000.
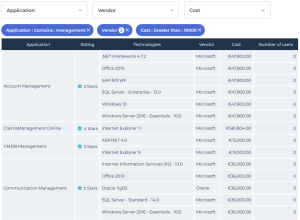
Example 4: filter on the table columns and cells (initial values)
For example, in an instant report generated from a Report DataSet with “Application Technologies” definition, you can prefilter the table data with the following three filters on the cells:
• display the “Microsoft” and “Oracle" vendors only
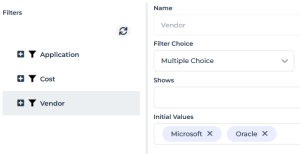
• display the applications that contain the word "management” only
• display costs greater than €10.000
The report result filters the applications that contain “management” in their name, whose vendors are “Microsoft”, “Red Hat”, and “Oracle”, and whose costs are greater than €10,000.