Launching an Instant Report
You can launch an instant report from:
• a list of objects
E.g.: a list from a tile of your home page or from a search result.
• a Report DataSet
Launching an instant report from a list
To launch an instant report from a list:
1. Display the relevant object list.
E.g.: in your home page, with the All applications tile, display the list of all applications.
2. (Optional) Filter the list on the objects you are interested in.
E.g.: applications with expenses > 1.
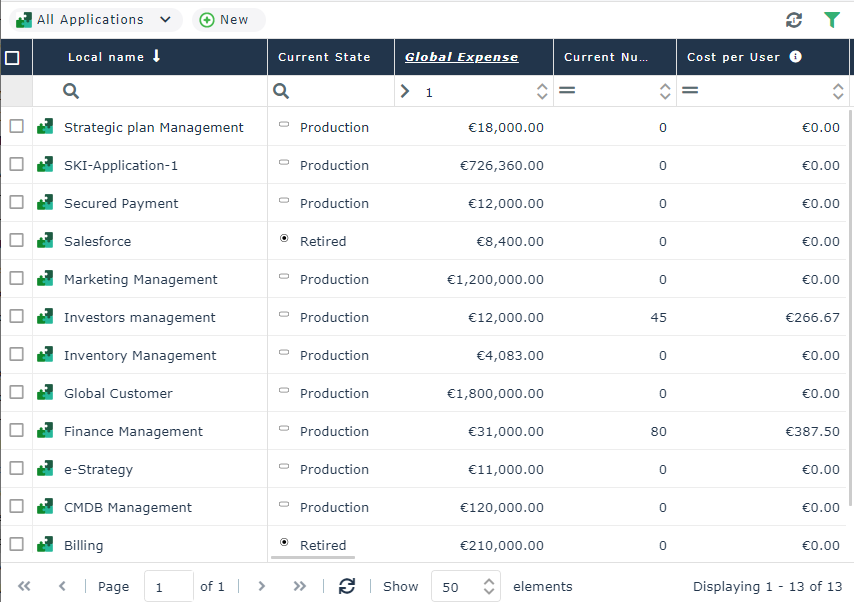
3. According to your needs:
• To launch the instant report on all of the objects in the list (all the pages): select the column header checkbox.
• To restrict the instant report to certain objects: select one or more objects.
4. Click Instant Report  .
.
. to access it.
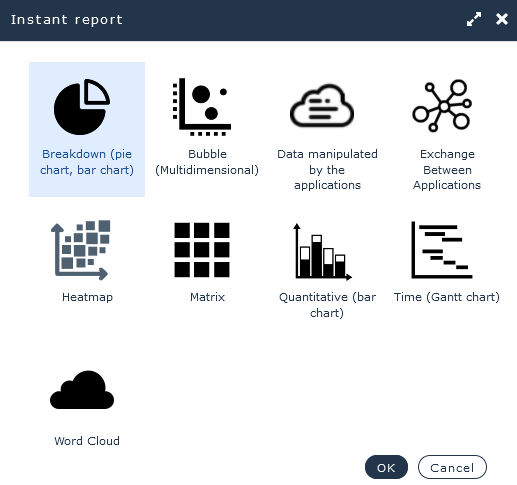
5. Select the required instant report type.
E.g.: breakdown (pie chart, bar chart)
6. Click OK.
The instant report is displayed in full page.
7. Depending on the instant report type selected, enter the instant report parameter information.
For example, for an instant report:
• of breakdown type, in the Group by field, select a grouping characteristic from the list.
• of quantitative type, select information to be taken into account in the graphic display.
Objects are automatically displayed according to the selected settings.
E.g.: "Current State".
For the set of selected applications, you get their breakdown according to their current state.
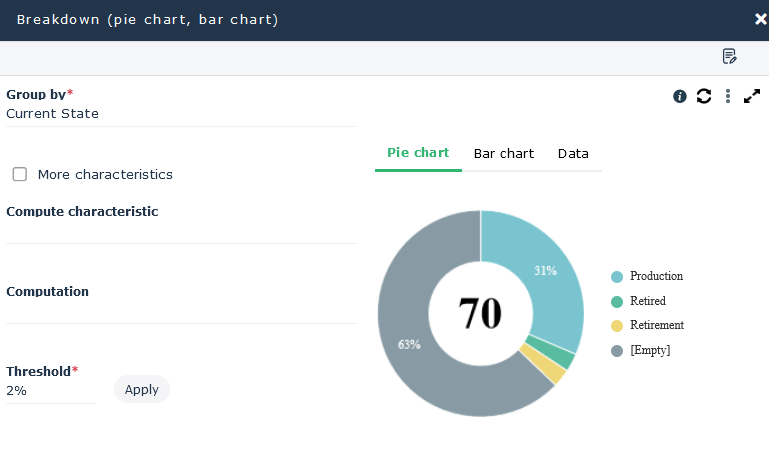
8. (if needed, for a breakdown type report) Select another type of breakdown display.
By default, the breakdown chart appears in the form of a pie chart; click on another type.
Example: Bar chart, Data.
9. (If needed) Click a part of the pie chart, a bar of the bar chart or a cell of the data table.
The list of objects contained in this part is displayed below the graph, in the Results window.
Launching an instant report from a Report DataSet
To generate an instant report from a Report DataSet:
1. Access the Report DataSet properties.
2. Display its Data page.
3. (If needed) In the Parameters section, add input parameters.
E.g.: with a Report DataSet with the "Application Technologies" definition, you can add applications.
4. In the Report DataSet section, click Refresh  .
.
.5. In the Report DataSet section, click Instant Report .
.6. Select the required instant report type.
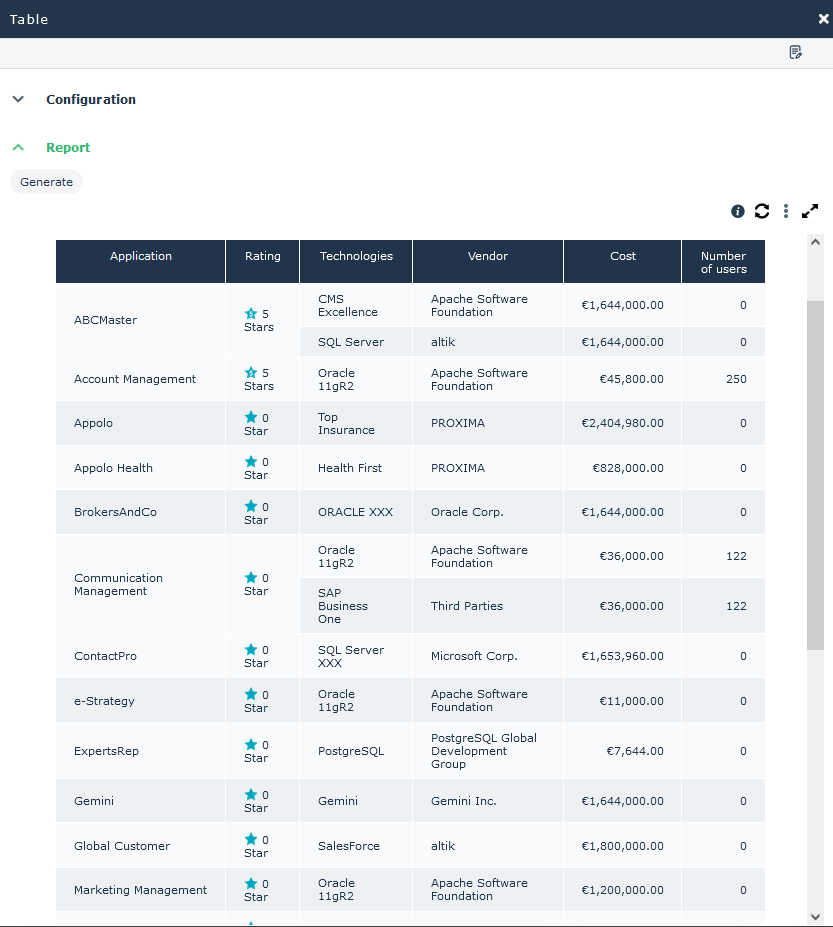
E.g.: Table
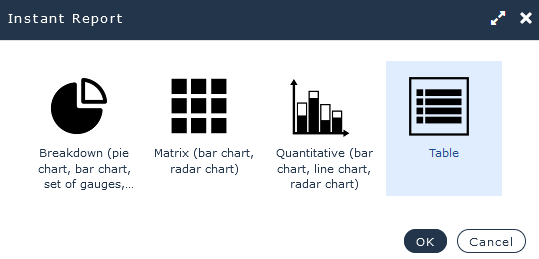
7. Click OK.
The instant report is displayed in full page.
Example: if it is a table, it contains as many rows as objects and as many columns as object characteristics.
8. (If needed) You can:
• customize the report display.
E.g.: You can customize the table to get a more precise description of the result and facilitate the analysis. For this, in the Configuration section, add one or as many filters as necessary to the input characteristics of the report.
• display icons in the table
• access the properties of the objects contained in the table cells (and modify them).
Launching several instant reports in parallel from a Report DataSet
From a Report DataSet, you can launch several instant reports in parallel and keep your HOPEX desktop at the same time to navigate or work.
To generate several instant reports from a Report DataSet:
1. Access the Report DataSets.
2. Roll the mouse over the Report DataSet name and click Open in a new tab  .
.
.The Report DataSet properties are displayed in a new browser tab.
You keep your HOPEX desktop in parallel.
3. Launch an instant report.
4. Repeat step 2 and 3 several times.
You get in each browser tab an instant report of the same Report DataSet.