Handling an Instant Report
Updating an instant report
When an instant report is not up to date, a message (at the top of the report) specifies the date of the latest generation of the instant report as well the time required for generation. If the data contained in the list of objects changes, you must refresh the instant report to take these changes into account.

To update an instant report:
1. Access the instant report.
2. In the Report section, click  .
.
.The report is updated.
Getting the list of objects contained in an instant report part
You can get the list of objects contained:
• bubble chart: in a bubble
• bar chart: in a bar of a series
• pie chart: in a section of the chart
• heatmap: in a cell of the map
• word cloud: in a tag
To get the list of objects making up part of the chart:
1. Access the instant report.
2. Click the chart part concerned.
The list of objects contained in this part is displayed in the Results window.
In the list, you can click:
• Properties  , to view the properties of an object in the list.
, to view the properties of an object in the list.• Excel  , to export the elements of the series in .xlsx format.
, to export the elements of the series in .xlsx format.• Instant Report  , to generate an instant report for the series.
, to generate an instant report for the series.Displaying the properties of an object contained in an instant report
In an instant report, you can access object properties of:
• objects displayed in the chart
Ex.: in a table or a matrix
• objects making up a part of the chart
Ex.: in a pie chart, bar chart, bubble chart, heatmap, or word cloud.
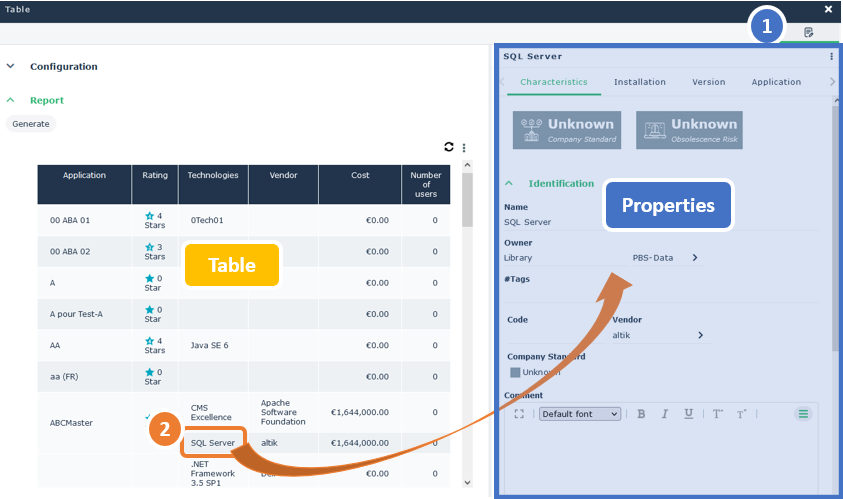
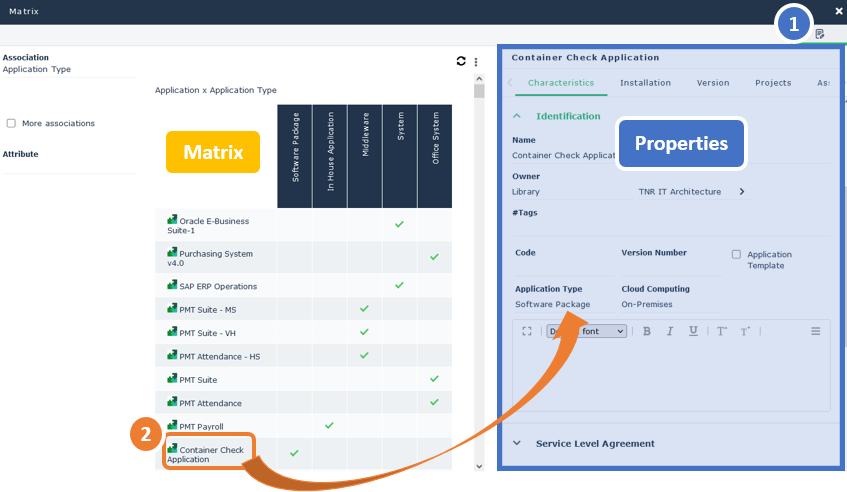
Table - Matrix
To display the properties of an object displayed in a table/matrix type instant report:
1. In the instant report toolbar, click  to display the Properties window.
to display the Properties window.2. Click the object.
Its properties are displayed in the Properties window.
E.g.: in a Table, click the object in a cell of the table.
E.g.: in a Matrix, click the object in a column/row header.
Pie chart - Bar chart - Bubble chart - Heatmap - Word cloud
In an instant report, to display the properties of an object making up a chart part:
1. In the instant report toolbar, click to display the Properties window.
to display the Properties window.2. In the chart, click the part concerned.
E.g.: in a pie chart.
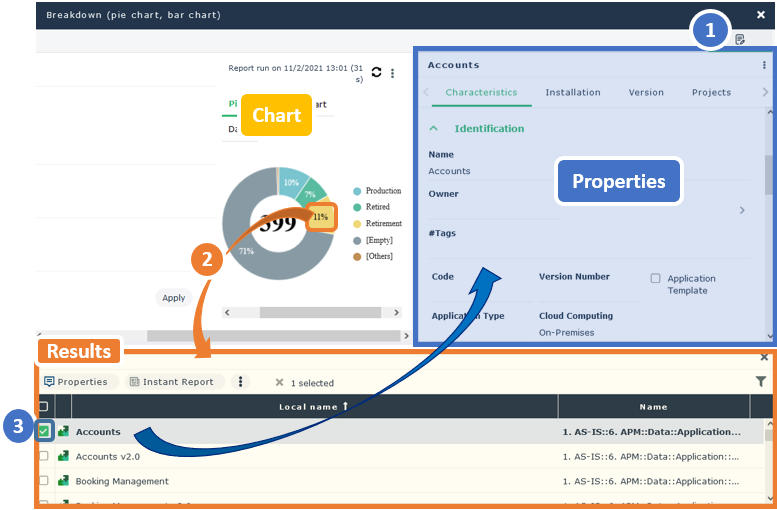
3. In the list of results, select the object.
Its properties are displayed in the Properties window.
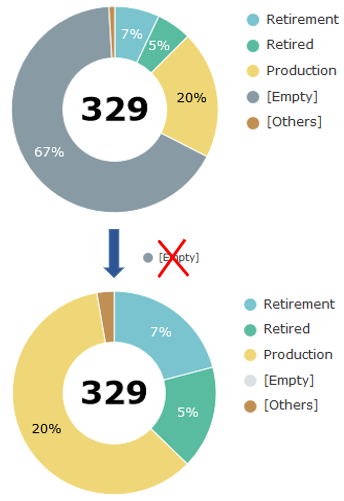
Hiding a data series
For improved readability, you can hide data series in the report chart.
To show/hide a data series:
1. Access the instant report.
2. In the report legend, click the data series concerned.
In the legend, the color that represents the series is grayed.
The series is not shown anymore in the chart.
Example: in the chart that displays the breakdown of applications according to their current state, you can hide the series “[empty]” that represents the applications whose current state is not entered.
3. In the legend, click the series again to re-display it in the chart.
Displaying the graph in full page
You can display the graph of an instant report in full page. You can not edit the report when using this display.
To display th egraph in full page: click Display in full page mode  on the top right corner of the graph.
on the top right corner of the graph. .
.