Accessing Reports
Reports of a Solution are accessible from the Reports navigation menu of each Solution.
By default, the list of reports recently viewed is displayed.
 Reports are sorted in alphabetical order.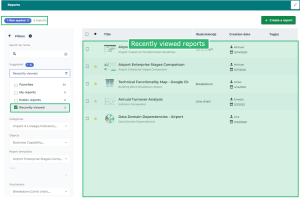
A filtering tool enables to display other reports and/or filter the displayed list.
To narrow down the list of displayed reports, you can:
• search for a report name
If you enter several terms, only the names containing all of them are searched.• search by filtering only, using one or several filters
 E.g.: you can display your reports only.
• mix search by name and filters
See Adding filters.Example 1: your filtering gives you the report you are looking for.
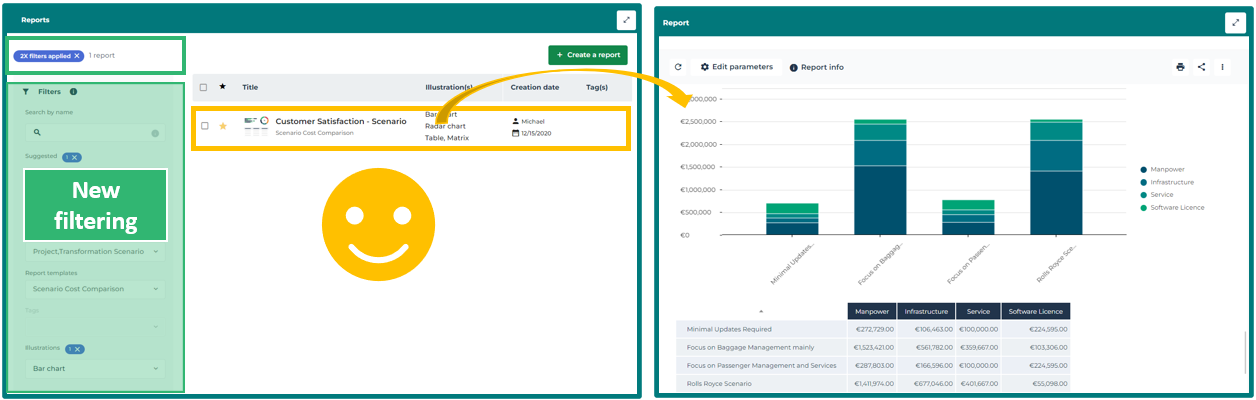
Example 2: your filtering does not give you the report you are looking for, you can then create a report.
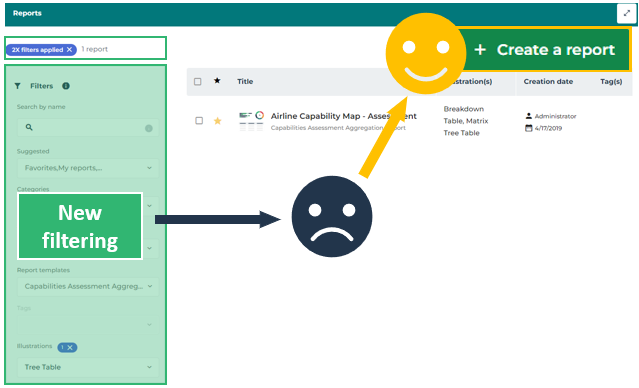
Example 3: the filtering is dynamic and narrows down as you select categories. If you cannot configure the required filtering, it means that the report does not exist. You can then create the report.
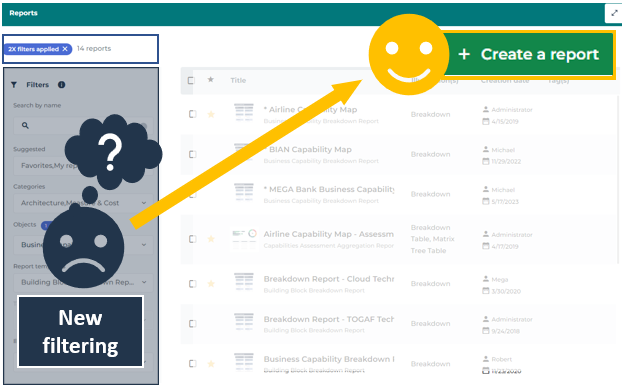
If you cannot find the report you are interested in, you can create it using one of the report types provided and define the data to be analyzed.
See Creating a Report.Accessing a report
To access a report:
1. In the navigation bar, click Reports.
The list of reports recently viewed is displayed.
2. To access other reports, use the Filters:
• (If needed) In the Search by name field, enter one or more words of the report name your are looking for.
To search for an exact string, add quotation marks to the string. Without quotation marks, the search results show the reports including at least one of the words entered.• (If needed) Narrow down the search using the Filters available.
See Adding filters.You can add multiple filters and select several values for each filter. The filtering is dynamic and narrows down as you select filters and values.
The filtering results are automatically displayed.
3. Click the name of a report to open it.
The report is displayed in the edit area.
If you need to return to the report list and keep your filtering: hover the cursor over the report name and click Open in new tab  .
.Adding filters
The following filters are available:
• Searching by name
Enables entry of one or more terms. If you enter several terms, the result contains only the names including all of the terms.
• Suggested
Gives access to the reports you could be specifically interested in. You can choose among:
• Recently viewed (selected by default)
• Favorites: the reports you have added to your favorites and the shared favorite reports
• My reports: the reports you have created or you are interested in (i.e. the ones you are connected to)
• Public reports: the reports belonging to nobody
• Categories
Enables to filter on one or more report categories.
Categories are specific to each Solution.• Objects
Enables to filter on one or more object types displayed in the report.
Objects types are specific to each Solution.• Report templates
Enables to filter on one or more report templates.
Report templates are specific to each Solution.• Tags
Enables to filter on one or more tags shown in the report.
• Illustrations
Enables to filter on one or more renderer types (see Report Renderer Types).
For each filter you can select one or more values. The result must contain at least one of the values of each filter.
The filtering is dynamic and narrows down as you select categories.
A search tool is available on each filter for a direct access to the value.
To add a filter:
1. Click the filter arrow.
The list of the filter values appears.
2. Select a value.
You can select multiple values.If needed, use the search field dedicated to the filter to access the value:
• Enter characters in the field: as you enter characters the list narrows down.
E.g.: in the search field of the Report templates filter, enter: “da”. The list narrows down to the report templates whose name includes “da”.
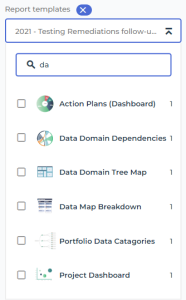
• Select one or more values.
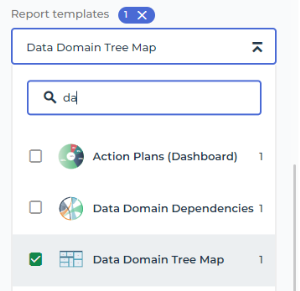
The number of values selected is displayed to the right of the filter name.
The list of reports matching the filtering is automatically updated.
3. (Optional) To fold the filter, click  .
.
.4. (If needed) Add more filters.
The filtering summary is shown above the filtering area:
• the number of filters applied
The number of values contained in each filter is indicated at each filter level.• the number of reports resulting from the filtering.
Examples:
Three categories of filters are applied here (each filter including one value), and the result shows one report:
- Search by name of the report: “domain”
- Suggested filter: “Recently viewed reports”
- Report templates filter: “Data Domain Tree Map”.
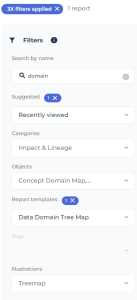
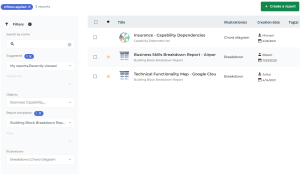
The search by report name is not used here, two filter categories are applied (each filter containing two values) and the result shows three reports:
- Suggested: “Recently viewed reports” or “My reports”
- Report templates: “Capability Treemap” or “Project Roadmap”
Removing a filter
You can remove a specific filter or all of them.
To remove a filter:
 At filter level, click the cross
  of the number of values of the filter.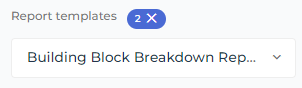
The filter and all of its values are deleted.
To delete all of the filters:
Above the filtering area, click the cross of the number of filters applied.
All of the filters are deleted.
Accessing your reports
Your reports correspond to the ones you create, you are concerned by, and the ones you saved:
• If you cannot find the report you are interested in, you can create it using one of the provided report types and define the data to analyze.
See Creating a Report.• If you are concerned by a report that you did not create, you can add yourself to the persons concerned by the report.
• To save the content of a report (an instant report or a report embedded in an object, for example), you can save it.
The reports concerning you are easily accessible.
To access the reports that are of interest to you:
1. In the navigation bar, click Reports.
The Reports page shows your recently viewed reports.
2. In the section Filters > Suggested:
• Select My Reports.
• Clear Recently viewed
The Reports page only shows your reports.
You can filter this list if needed.In your homepage, you have direct access to the report of your choice.See also:
Accessing embedded reports in an object
Some reports are embedded in the repository objects.
To access the full list of available reports, see Accessing Reports and perform a search with the Objects filter.These reports can vary depending on Hopex Solutions and provide near-instantaneous analyses on the selected objects according to a given problematic. For example:
• the functional analysis of a process
• a project portfolio roadmap
• the cost of an application portfolio
For more details on the provided report templates, see the documentation about the corresponding solution.Embedded reports are available in the properties of these objects, in the Reporting page:
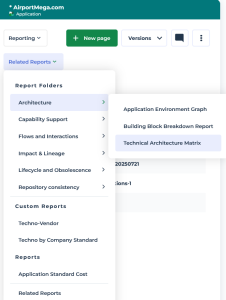
The Reporting page displays the last report displayed in the Reporting page of this object or of another object of the same type.• Report Folders
Reports are sorted by topics.
To customize this section, see How to Add Reports to Object Property Pages and How to Customize the Reporting Page of an Object.E.g.: in the Enterprise Architecture Solution, in the Reporting property page of an application, the Architecture folder gives access to three reports.
• Custom Reports
These reports are custom reports not added to report folders.
E.g.: dendrogram-type instant reports added to the Reporting property page of an object.
• Reports
These reports are provided reports, not added to report folders as considered more important.
E.g.: in the Enterprise Architecture Solution, in the Reporting property page of an application, the Reports section includes the “Application Standard Cost” report.
• Related Reports
These reports are all the reports (reports and reports MS Word) related to the object.
Accessing embedded reports in My dashboard
If My dashboard feature is not available in your Solution, you can add it (in the options: Workspace > Dashboards, select My Dashboard). The Hopex Enterprise Architecture desktop includes a dedicated read-only dashboard. Both dashboards can coexist.
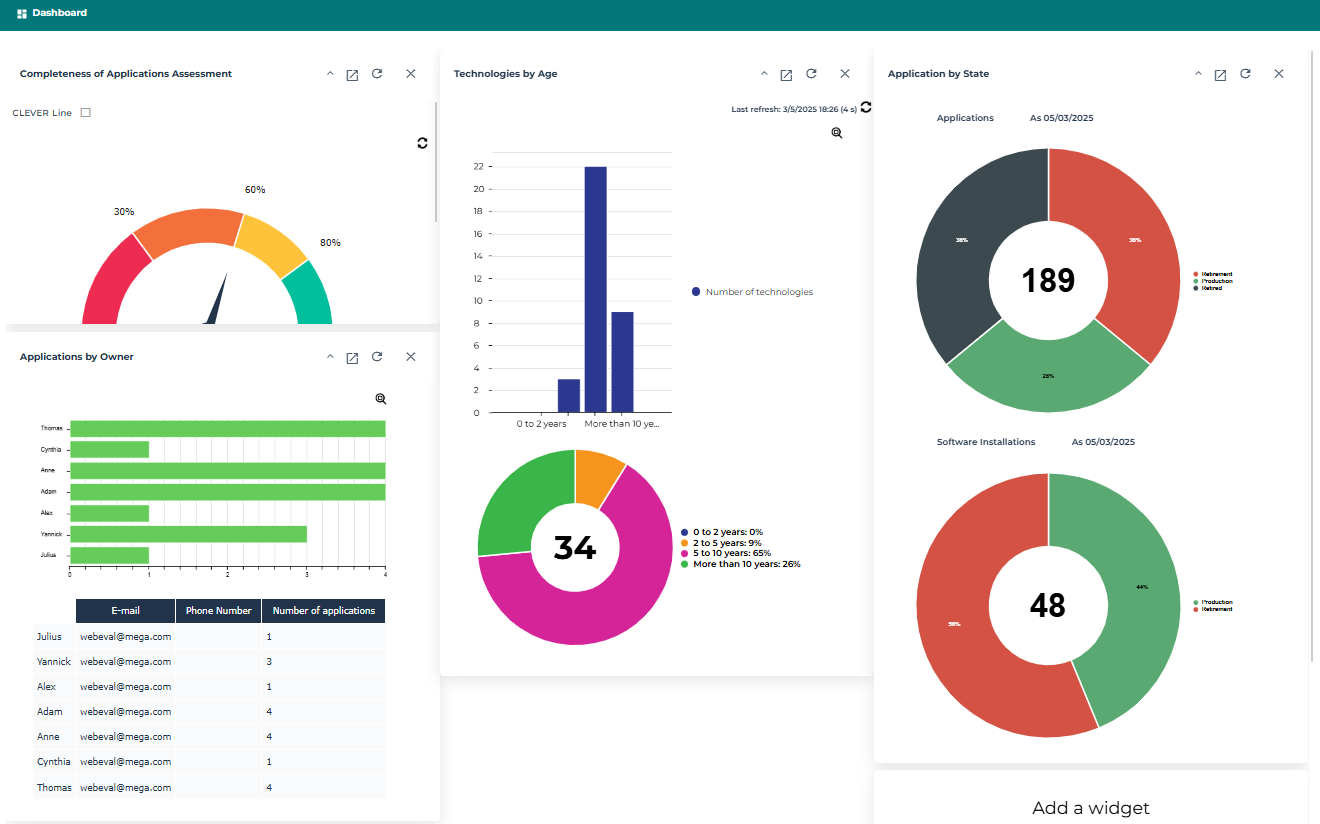
My dashboard is used to quickly access repository information. The embedded reports that you are able to display in your dashboard depend on the solutions and profiles. They provide key indicators on your repository data.
You can:
• add a report as a widget to your dashboard to access it more quickly.
• add an instant report as a widget to your dashboard to access it more quickly.
To add an instant report to your dashboard, see Adding an Instant Report to your Dashboard.To view a report available in your dashboard:
1. In the navigation bar, select My dashboard.
Reports you added to your dashboard display.
2. (If the widget of the report is folded) Click  to expand the widget and display the report.
to expand the widget and display the report.