Customizing your Dashboard
Both dashboards can coexist.
Your dashboard is made up of widgets, which use formatters in the form of reports or other HTML pages. They enable fast access to repository information.
Example: your reports.
Accessing your dashboard
To access your dashboard and widgets:
 menu.
menu.Adding a dashboard to your desktop
If My Dashboard menu is not available by default in your navigation bar, you can add it up.
menu is not available by default in your navigation bar, you can add it up. To add the My Dashboard menu to your navigation bar:
1. Access your Options.
2. Select Workspace > Dashboards, and select My Dashboard option.
The menu pops up in your navigation bar.
 drop-down menu to access it.
Adding a widget to your dashboard
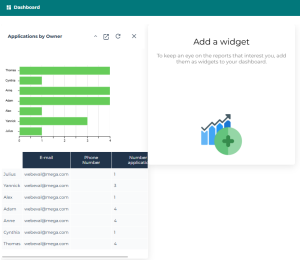
To follow the reports you are interested in, you can add them as widgets in your dashboard.
To add a widget to your dashboard:
1. In the navigation bar, select My Dashboard.
2. In your dashboard, click Add a widget  .
.
.A window displays the tree of the elements you can add. These elements are classified according to their category.
3. Expand the folder of the category concerned.
Example: GRC, and the Risks subfile.
4. Click the report concerned.
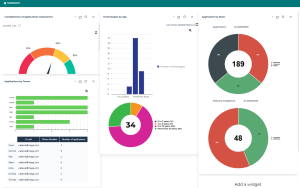
The report is displayed as a widget in your dashboard.
You can add several widgets to your dashboard.
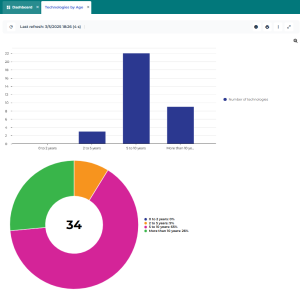
Displaying a widget in full page

Expanding/Collapsing a widget window


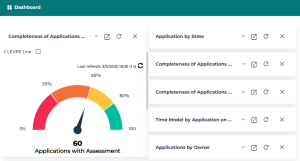
Updating the widget content

Deleting a widget
