Handling a Report
Displaying a chart in full page
You can display a chart from a report in full page. With this display you cannot:
• edit the report
• view the list of objects contained in a part of the chart at the same time (it is displayed in the edit area below the chart)
To display the chart in full page: click Display in full page  on the top right corner of the chart.
on the top right corner of the chart. .
.Displaying a report in a new tab
You can open a report in a new tab. That way you can keep, in parallel, several reports.
To display a report in a new tab:
1. Access the reports.
2. Hover the mouse over of the report name and click Open in a new tab  .
.
.You can then display several reports in multiple tabs.

Updating a report
Some reports may contain snapshots that save the input parameters and enable to reproduce the results of a report quickly when it is refreshed.
When the report has a snapshot, a message (at the top of the report) specifies the date of the latest generation of the report as well as the time required for generation.

If the data contained in the list of objects changes, you must refresh the report to take these changes into account.
To update a report:
1. Access the report.
2. In the report toolbar, click Refresh the report  .
.
.The report is updated.
Getting the list of objects contained in a report part
You can get the list of objects contained:
• bubble chart: in a bubble
• bar chart: in a bar of a series
• pie chart: in a section of the chart
• heatmap: in a cell of the map
• word cloud: in a tag
• matrix:: in a cell
• Set of gauges: in a gauge
To get the list of objects making up part of the chart:
1. Access the report.
2. Click the chart part concerned.
 .
.The list of objects included in this part is displayed bellow the chart.
In the list, you can click:
• Instant Report  , to generate an instant report for the series.
, to generate an instant report for the series.• Excel  , to export the elements of the series in .xlsx format.
, to export the elements of the series in .xlsx format.Displaying the properties of an object contained in a report
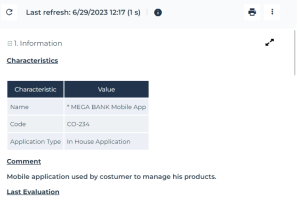
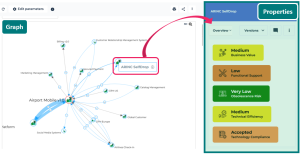
In a report, you can access object properties of:
• objects displayed in the chart
E.g.: in a table, a matrix, a graph, a breakdown map, a treemap, a dendrogram, a tree table, a Gantt chart.
You can display the object properties:
• in a pane to the right of the report
• in new tab
• objects making up a part of the chart
Ex.: in a pie chart, bar chart, bubble chart, heatmap, word cloud.
You can display the object properties:
• in the panel to the right of the report
• in a new tab
• instead of the chart
Table - Matrix - Graph - Breakdown map - Treemap - Dendrogram - Tree table - Gantt chart
To display the properties of an object contained in a report:
The object properties are displayed in the panel to the right. You can modify them.
E.g.: in a Table, click the object in a cell of the table.
 to display its properties in a new tab and access it easily later on.
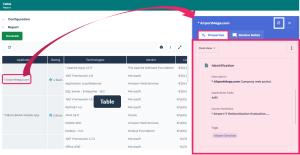
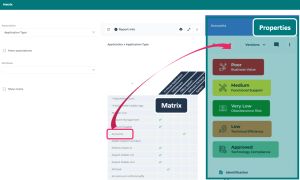
E.g.: in a Matrix, click the object in a column/row header.
E.g.: in a graph, click the object.
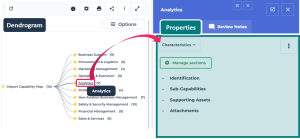
E.g.: in a Dendrogram, click the object. The path from the source object is highlighted with a bold blue line.
Pie chart - Bar chart - Bubble chart - Heatmap - Word cloud
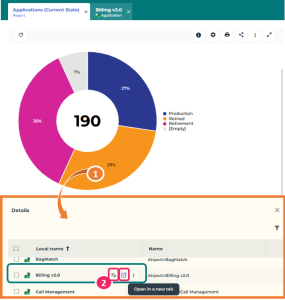
In a report, to display the properties of an object making up a chart part:
1. In the chart, click the relevant part.
E.g.: in a pie chart.
The list of objects making up this chart part displays below the chart.
2. In the result list, hover the cursor over the object, then:
• select Open in a new tab  to display its properties in a new tab.
to display its properties in a new tab.• select Properties  to display its properties instead of the report.
to display its properties instead of the report.• click the object name to display its properties in the panel to the right of the report.
Printing a report
To print the content of a report:
1. Open the report.
2. In the report toolbar, click Print the report  .
.
.If the report includes several chapters, all of them are printed.
Exporting a report in Excel format
You can export certain report data in Excel format.
format. This feature is available for Java report chapters but does not apply to VB or VBScript reports.
By default, the export generates an .XLSX file. To generate the report in .XLS format, see Managing Report Options.
Excel export limitations:
• Certain charts such as the Gantt chart are not supported.
• Views of over three dimensions are not processed.
To export the content of the Excel format report:
1. Open the report.
2. To export:
• the content of the full report: in the report page, click Plus  > Excel .
> Excel .• the content of a specific report chapter: at the title level, click Excel
The generated file presents one Excel sheet per chapter bearing the name of the chapter if there is one, or by default the name of the report type followed by a number (starting with 1).