HOPEX Supervision Console Description
The HOPEX Supervision Console summarizes HOPEX supervision information in dedicated views: Computers, Processes, Users, Sessions, Events, and Macro.
The HOPEX Supervision Console toolbar enables to define the data displayed in the views.
The HOPEX Supervision Console monitors the activity within HOPEX and enables to understand and investigate about any anomaly at any time (e.g.: macro abnormal long execution time).
HOPEX Supervision navigation panes
Events are grouped by calculated views that give access to the corresponding list of prefiltered events.
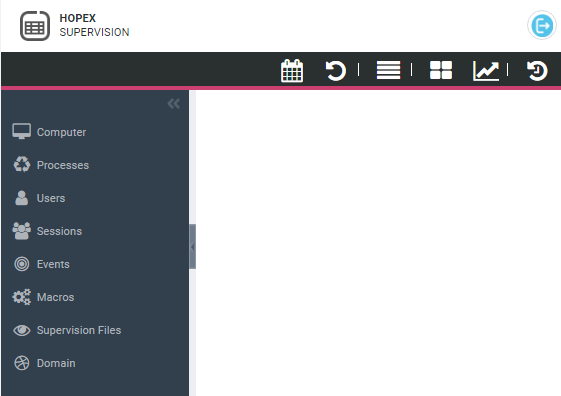
The HOPEX Supervision Console navigation panes give access to each dedicated view:
•  Computer: the list of servers used by HOPEX
Computer: the list of servers used by HOPEX•  Processes: the list of instantiated processes
Processes: the list of instantiated processes•  Users: the list of users who connected to HOPEX
Users: the list of users who connected to HOPEX•  Sessions: the list of HOPEX current or past sessions
Sessions: the list of HOPEX current or past sessions•  Events: the main important events that occurred in HOPEX
Events: the main important events that occurred in HOPEX•  Macros: the list of all the macros for which execution time is high
Macros: the list of all the macros for which execution time is high•  Supervision Files: the supervision file location (sspsprvsYYYYmmDD.txt format)
Supervision Files: the supervision file location (sspsprvsYYYYmmDD.txt format) •  Domain: a comparison of the Execution and Supervision domains
Domain: a comparison of the Execution and Supervision domainsHOPEX Supervision Console tool bar
The HOPEX Supervision Console tool bar includes:
• Open supervision data file  to define the supervision data files to be displayed in the supervision views.
to define the supervision data files to be displayed in the supervision views.• Refresh  to refresh the information in real time (current supervision data file only).
to refresh the information in real time (current supervision data file only).• All Events  to access all of the events (not filtered) that occurred in HOPEX.
to access all of the events (not filtered) that occurred in HOPEX.• Consolidated snapshots  to access a computed view of consolidated snapshots (list).
to access a computed view of consolidated snapshots (list).• Consolidated snapshots Graph  to display the consolidated snapshot graph.
to display the consolidated snapshot graph.• History  to access your last displayed windows.
to access your last displayed windows.