Launching an Instant Report
You can launch an instant report from:
• a list of objects
E.g.: a list available in a tile of your home page, in a search result, or in the result of an analysis report when the latter allows this.
• an object
E.g.: the Application Environment Graph is available for an application.
• a Report DataSet
To launch and keep several instant reports in the edit zone, see Launching several instant reports.
Launching an instant report from a list
To launch an instant report from a list:
1. Display the relevant object list.
E.g.: in your home page, from the All Applications tile, display the list of all the applications.
2. (Optional) Filter the list on the objects you are interested in.
E.g.: applications with expenses > 1.

3. (optional) By default the instant report is launched on all the objects included in the list (all pages). Select the objects concerned to restrict the instant report to the selected objects. You can select a single object only.
4. Click Instant Report  .
.
. to access it.
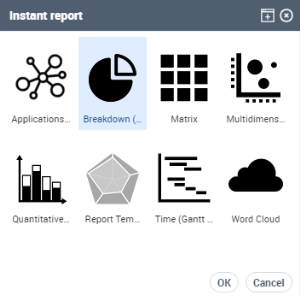
5. Select the required instant report.
You can create matrix, multidimensional, word cloud, quantitative, breakdown, or time-type instant reports.
Example: Breakdown.
6. Click OK.
The instant report is displayed in the View edit area.
7. Depending on the type of instant report selected, you can enter the instant report parameter information.
For example, for an instant report:
• of breakdown type, in the Group by field, you can select a grouping characteristic from the list of attributes offered.
• of quantitative type, you can select information to be taken into account in the graphic display.
Objects are automatically displayed according to the selected grouping.
Example: "Current State".
For all selected technologies, you get their breakdown according to their current state.

8. (if need, for a breakdown type report) Select another type of breakdown display.
By default, the breakdown chart appears in the form of a pie chart; click on another type.
Example: Bar chart, Data.
9. (optional) If necessary, click in a part of the pie chart, in a bar of the bar chart or in a cell of the data table.
The list of objects included in this part appears in the Search and results window.
Launching an instant report from an object
To launch an instant report from an object:
1. Access the object.
Example: an object in a list or in a diagram.
2. In the object pop-up menu, select Documentation > <instant report name>.
Example for an application: Documentation > Application Environment Graph.
The instant report is displayed in the View edit area.
Launching an instant report from a Report DataSet
To generate an instant report from a Report DataSet:
1. Access the Report DataSet properties.
2. Display the Data page.
3. (If needed) In the Parameters section, click Add and select the input parameters.
E.g.: with a Report DataSet with the "Application Technologies" definition, you can add applications.
4. In the Report DataSet section, click Refresh  .
.
.5. In the Report DataSet section, click Instant Report .
.6. Select the required instant report.
Example: Table
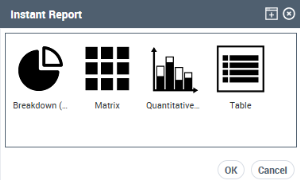
7. Click OK.
The instant report is displayed in the Navigation edit area, Report section.
Example: If it is a table, it contains as many rows as objects and as many columns as object characteristics.
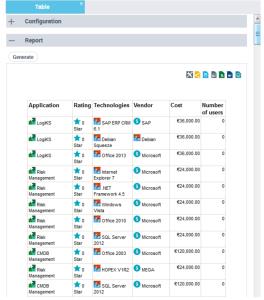
8. (Optional) You can customize the report display.
You can customize the table to obtain a more precise description of the result and facilitate the analysis. For this, in the Configuration section, add one or as many filters as necessary to the input characteristics of the report.
Launching several instant reports
To display several instant reports in your View edit area, you must be in Multi-view  display before launching another instant reports.
display before launching another instant reports.In Single-view  display (by default), the second instant report replaces the current one.
display (by default), the second instant report replaces the current one.