Handling a Breakdown Report
A breakdown report can be specialized and adapted to each Solution specific needs. This type of report enables to display the breakdown of an “Architecture Building Block” type root object (e.g.: Capability map) into sub-objects of different types and analyze their fulfillment by “Solution Building Block” type objects (e.g.: Application).
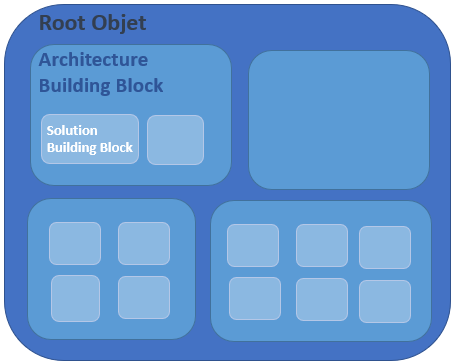
The Report Template showing a breakdown map is based on:
• a root object
• analysis criteria (on each breakdown level)
You can:
• modify the number of levels displayed in the report
• modify the analysis criteria:
• add or remove analysis criteria
• modify the analysis criteria appearance (background color and forms)
• hide analysis criteria
• highlight a criterion (e.g.: attribute or rating)
• zoom in on a component
• filter:
• the report display according to specific criteria values
• the items of a breakdown level using a predefined query
• display:
• all the elements of a component (when a component includes more than 11 elements)
• the object icons
• an object (component or element) properties in the breakdown map, see Displaying the properties of an object contained in a report
Customizing a breakdown report display
By default, all levels and all MetaClasses are displayed when the report is opened. If needed, you can reduce the report content display when opening the report.
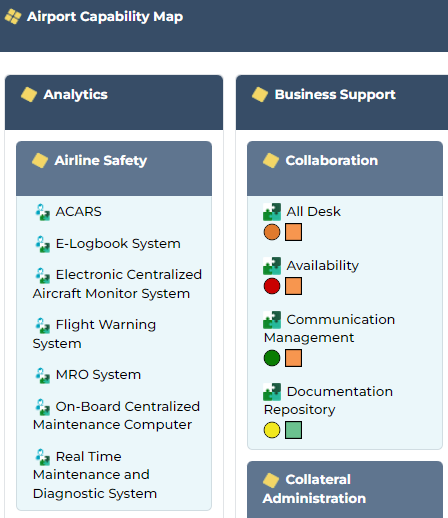
In a breakdown report, you can display object icons:
• component icons
E.g.: Business Capability Map icons.
• item icons (default configuration)
E.g.: Application and Application System icons.
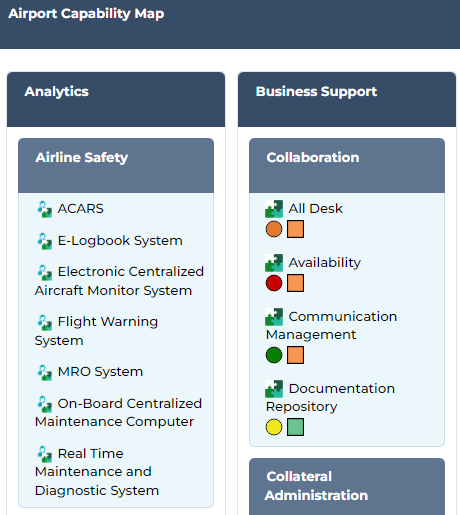
• both component and item icons
E.g.: Business Capability Map, Application, and Application System icons.
You can increase (or reduce) the column minimum width.
To modify the breakdown report display:
1. Edit the breakdown report (click More  > Edit Report
  ).
).
> Edit Report ).The edit pane appears to the right.
2. In the Content section, modify the relevant parameters value:
• Levels at opening
• Show all MetaClasses at opening
3. In the Style section, modify the relevant parameters value:
• Show component icons
• Show item icons
• Min Column Width
4. Click Apply.
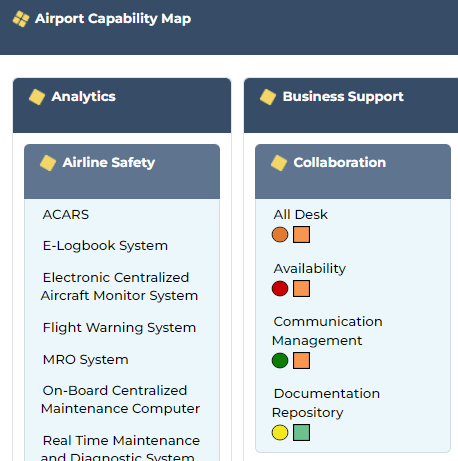
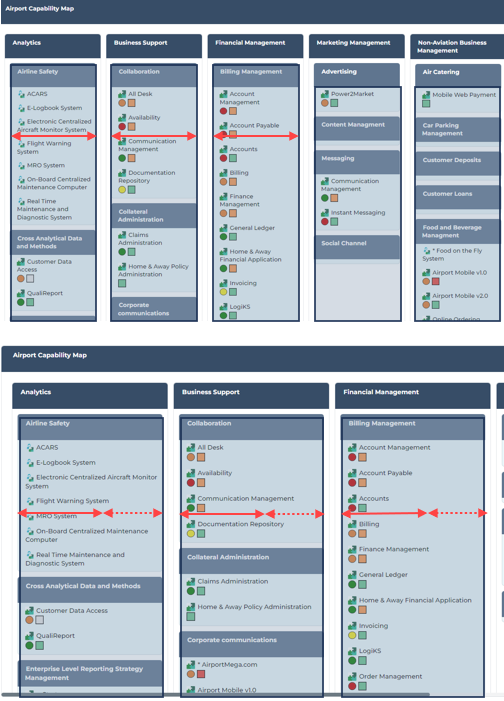
Example of a Report Template showing a breakdown map
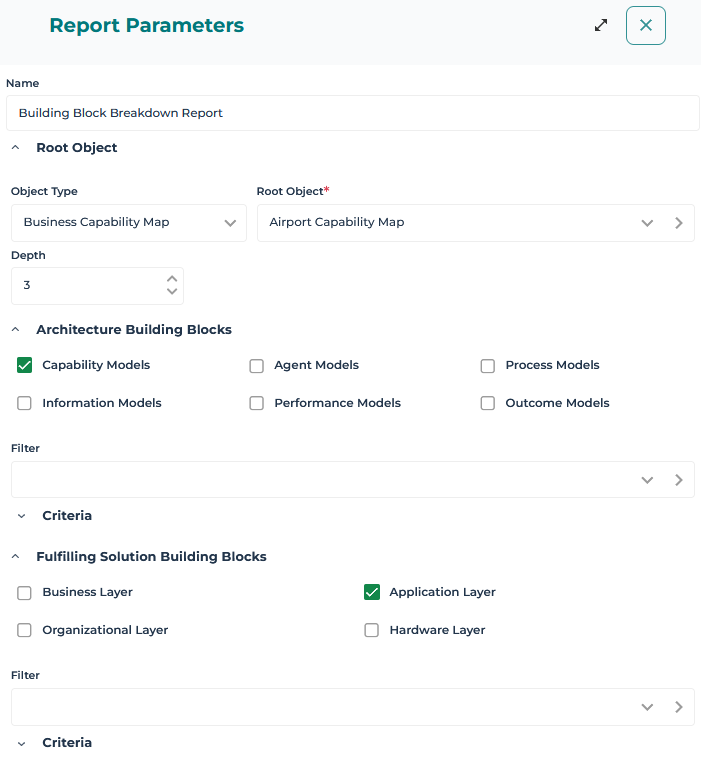
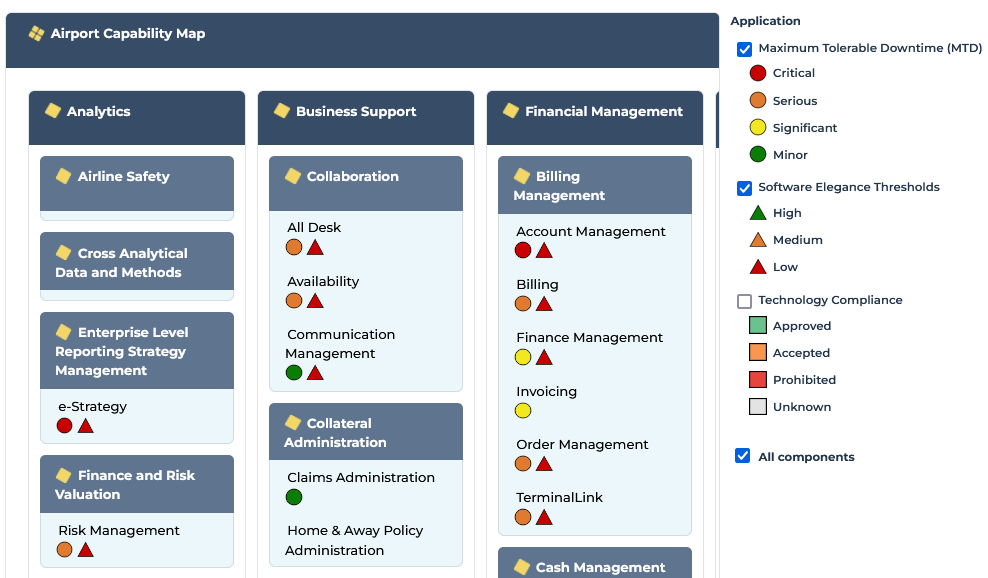
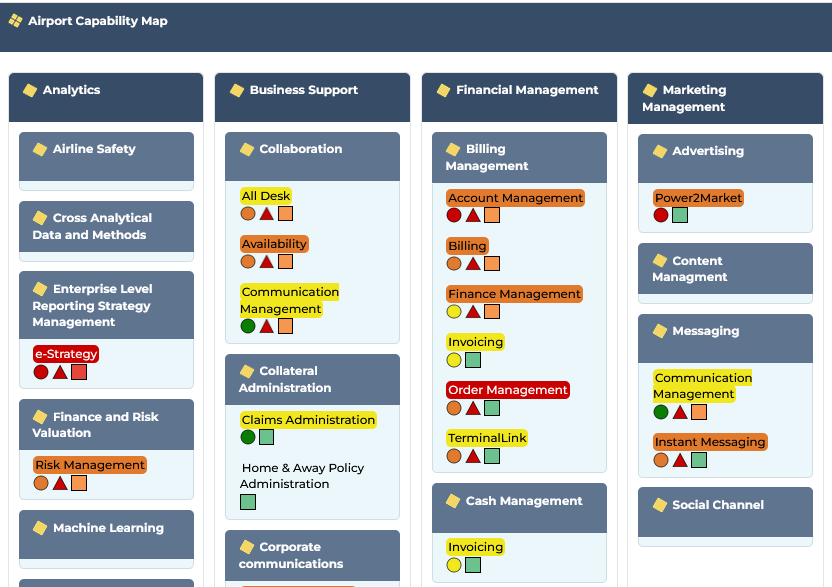
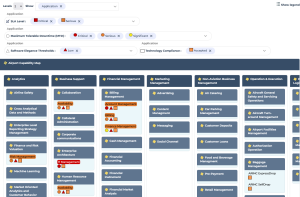
The “Building Block Breakdown Report” shows a breakdown map.
The “Building Block Breakdown Report” report template details the breakdown of a Root Object (e.g.: the “Airport Capability Map” Business Capability Map) according to selected classifier objects:
• Architecture Building Blocks
E.g.: Capability Models.
• Fulfilling Solution Building Blocks
E.g.: Application layer.
For each building block, you can add:
• a content filter (using a query)
Examples:
The “Capabilities with fulfilling solutions building blocks” filter, which you can add to the Architecture Building Blocks, enables to display only capabilities fulfilled by applications (Solution building blocks).
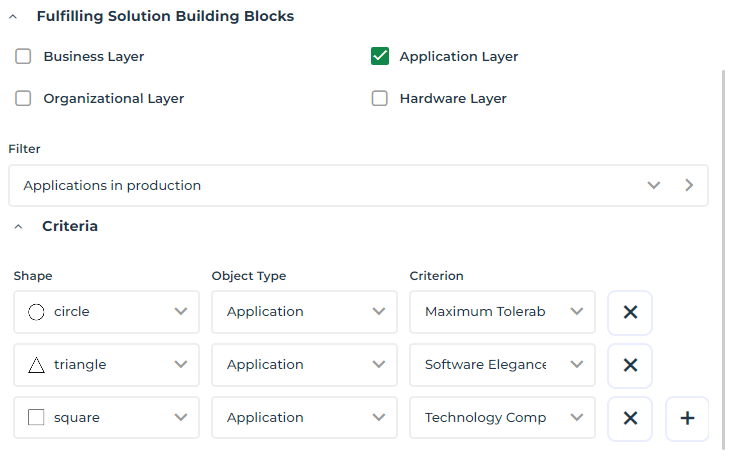
The “Applications in production” filter, which you can add to the Fulfilling Solution Building Blocks, enables to display only the applications that are in production.
• analysis criteria and choose their associated symbols (forms)
Examples:
The “Maximum Tolerable Downtime” of an application is represented by a circle.
The “Software Elegance Thresholds” of an application is represented by a triangle
The “Technology Compliance” is represented by a square.
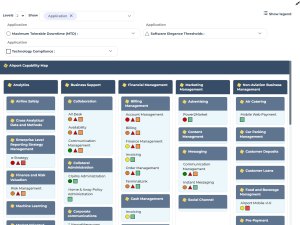
To configure a breakdown map display:
• To modify the object types that hold the analysis criteria, in the Show field:
• click the cross  of the object types you do not want to display
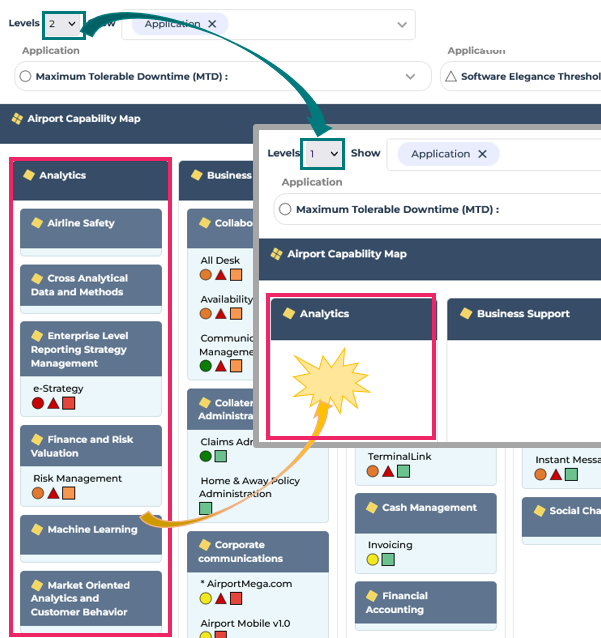
of the object types you do not want to display • click the arrow and select the object types to display
E.g.: this example includes only one object type: Application.

• To lighten a breakdown map display, in the Levels field, select an upper level.
Lower levels are hidden.
• To view the analysis criteria and their values, click Show legend.
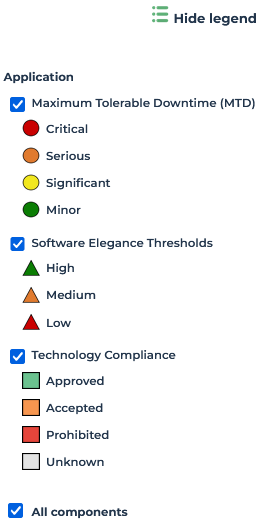
• To hide an analysis criterion in the report, in the legend clear the criterion.
E.g.: clear “Technology Compliance”.
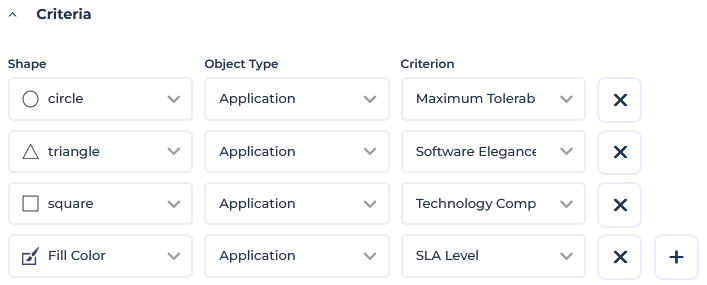
• To add an analysis criterion, click Edit Parameters  and in the Criteria section:
and in the Criteria section:• Click Add Criterion  .
.
.• In the Shape column, select the symbol associated with the criterion, or select “Fill Color” to highlight this criterion (adding back ground color to the name of the object).
E.g.: Fill Color.
• In the Object Type column, select the type of object bearing the analysis criterion.
E.g.: Application.
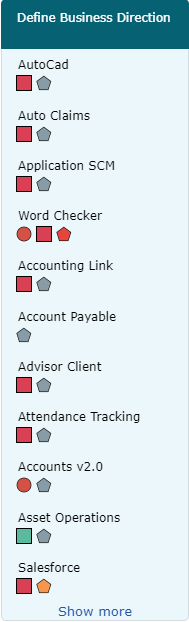
• In the Criterion column, select the object parameter. The values of this parameter are represented by colors.
E.g.: SLA Level of the application.
• Click Apply.
The parameter is added to the legend.
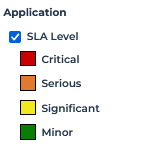
If you chose the “Fill color” shape, object names have as background color the color that represents the value of the criterion selected.
E.g.: The name of the applications has as background color the SLA level value of the application.
• To zoom in on a component, click the component title area (outside its name).
The report breadcrumb trail indicates that you are one lower level down.
The selected component widens over the whole space of the breakdown map and displays its components, its items, and/or analysis criteria.
You can move down in the map levels, as long as the component includes components.
 to move up to the previous level.
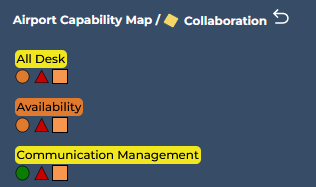
• To filter the report display according to specific criteria values:
• In the criteria field, click the arrow and select the values you want to apply to the filtering.
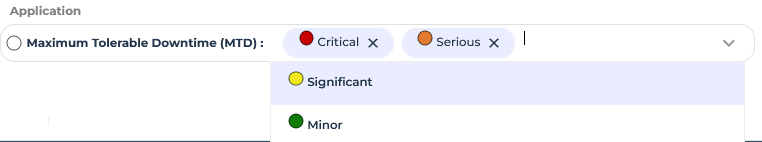
• You can add as many values on as many criteria you want to the filtering.
The report displays only the items matching the filtering.
• To remove a criteria value from the filtering, click its cross  .
.
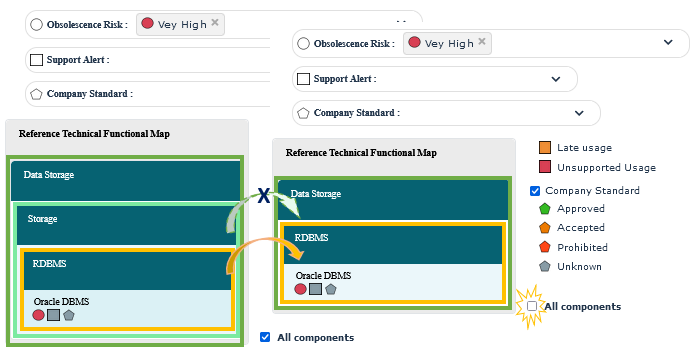
.• To lighten the display when using the filters, you can hide the intermediate components that do not match the filtering but include components matching the filtering: in the legend, clear All components.
E.g.: Filtering the Obsolescence Risk with “Very High” value.
Here Storage does not show this value, but includes RDBMS that shows this value.
When you clear All components, the Storage intermediate component is hidden.
• To display all the items of a component, below the last displayed item, click Show more.
• To display object icons or modify the minimum column width, see Customizing a breakdown report display.