Analysis Report
The analysis reports are dynamic reports that enable repository data analysis according to different perspectives.
Accessing HOPEX Data Governance Reports
To access HOPEX Data Governance reports:
Some analysis reports are also embedded in the repository objects. These reports are available in the properties of these objects, in the Reports page.
For example, the reports visible under the Reports menu that are specific to the Data Domain Map object are also accessible in the properties of a data domain map.
These embedded reports are dynamic, updating automatically with the object's characteristics.
Description Reports
The View Report
See The View Report.
Glossary Report
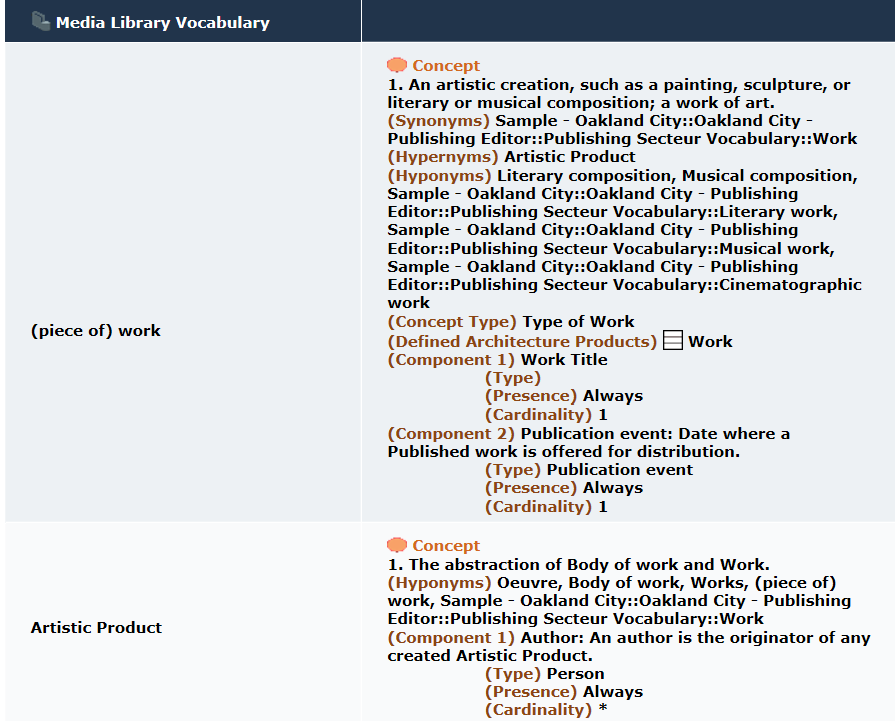
HOPEX Data Governance provides a ready-to-use glossary report to automatically build the business glossary of terms derived from a set of Business dictionaries. For each term, the glossary displays a list of associated definitions with their text, synonyms and components list.
Report parameters
This consists of defining report input data.
Parameters | Parameter type | Comment |
|---|---|---|
List of libraries | Library | Not mandatory |
List of business dictionaries | business dictionary | Mandatory if no library |
Example option | yes or no | Used to display the business information examples |
Show the component type icon | yes or no |
Report example
The example below shows the terms from the "Media Library" dictionary.
Data Domain Map
On a data map, two report templates allow you to visualize the hierarchy of the domains that make it up.
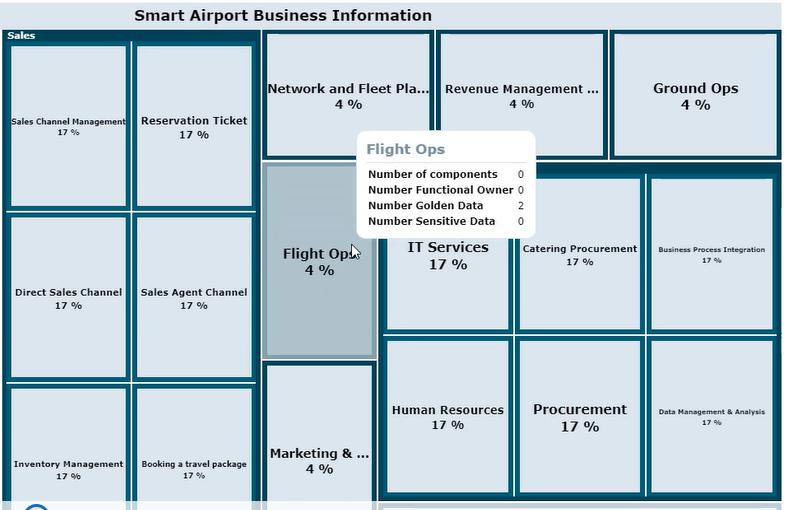
Data Domain Tree Map Report
In this report, filters allow you to view:
• the number of components in each domain
• the number of functional owners
• the number of reference data
• the number of data declared as sensitive.
Data Map Breakdown Report
This report also displays the domains that make up the map. The following information is available for each domain:
• the number of sensitive data
• the number of reference data
• average data quality
Realization Chart
Data Domain Dependencies
Based on a data map, this report presents the structural dependencies of the data used between data areas in the form of a string graph.
It is possible to dive into a data domain and view the dependencies between sub-domains where they exist.
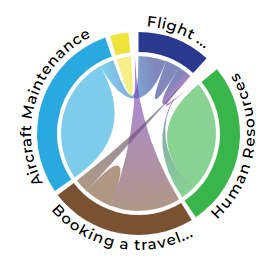
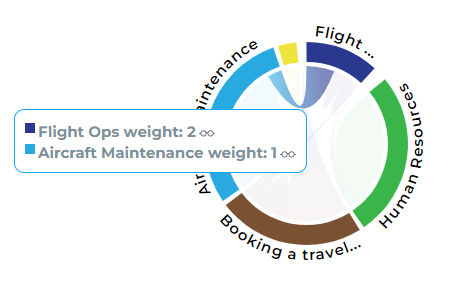
By selecting a domain, its links with the other domains are highlighted.
Below you can see the links between the "Maintenance" data domain and the "Flight Ops" data domain.
Word Cloud Reports
Amount of Information in Information Areas
This report template relates to areas of an information container.
In the generated report, the size of the area name is proportional to the number of information that compose the area.
Extent of the Description of the Information
This report template relates to information containers (business dictionary, data dictionary, database) and display the corresponding elements: concepts, classes, tables, etc.
In the report, the size of the element name is proportional to the number of information that characterize it (for example attributes and relations that characterize a class).
Use of Information in Data Area
This report template relates to information containers (business dictionary, data dictionary, database) and display the corresponding elements: concepts, classes, tables, etc.
In the report, the size of the element name is proportional to its use in the information areas.
Data Usage Reports
Use of information held by a container
For the object selected as input (eg: a package), the report displays:
• the information that it holds (eg: classes or data views)
• the areas that use this information, with which access rights
• the applications that use the areas (via data stores that are used to declare them on the applications, application systems, application service or microservice), and through which components (in read-only or read/write).
A report template presents this information in the form of a dendrogram, another report template in the form of a table.
Report parameters
This consists of defining report input data.
Parameters | Object types |
|---|---|
Subject | Business dictionary Database Package Data Model Catalog of NoSQL data building block Data type packages |
Use of information in an domain
For the object selected as input (an area), the report displays:
• the information used (eg: classes or data views in the case of an application data area), with which access rights.
• in which applications the selected area is used (via data stores that are used to declare them on the applications, application systems, application service or microservice), and through which components (in read-only or read/write).
Report parameters
This consists of defining report input data.
Parameters | Object types |
|---|---|
Subject | Application data area Logical Data Area concept domain File structure Relational data area NoSql data area |
A report template presents this information in the form of a dendrogram, another report template in the form of a table.
Use of information of an information map
The input parameter is an information map that can group together one or more area(s).
This report displays
• the areas and the data that it uses, with the access rights for this data.
• in which systems (applications, application systems, application services or microservice) the areas are used and with which components of these systems, specifying the access mode (read-only or read/write).
A report template presents this information in the form of a dendrogram, another report template in the form of a table.
Use of information
The root object of the report consists of an item of information (concept, class, data view, table, etc.). For this root, the report displays:
• the areas that use this information, with which access rights
• in which systems (applications, application systems or microservice) these areas are used and with which components of these systems, specifying the access mode (read-only or read/write).
Report parameters
This consists of defining report input data.
Parameters | Object types |
|---|---|
Subject | Class Concept State concept Event concept Concept type Entity Period type Representation type Table Datatype Concept view Data view Physical view |
Use of information of the domains of a container
For the object selected as input (a container), the report displays:
• the areas owned
• the domains used by the areas, with which access rights
• the systems that use these areas and the access mode of the components of these systems (read-only or read/write)
Report parameters
This consists of defining report input data.
Parameter | Object types |
|---|---|
Subject | Business dictionary Database Package Data Model Catalog of NoSQL building blocks Data type package |
Regulatory Reports
Regulatory Framework Report
This report displays the list of information constrained by a regulatory framework.
Constrained objects are those for which a regulatory framework has been associated in the Regulations page of their properties (for example, a concept).
The report displays the articles and sections of the regulation and highlights those that are constraints on the data.
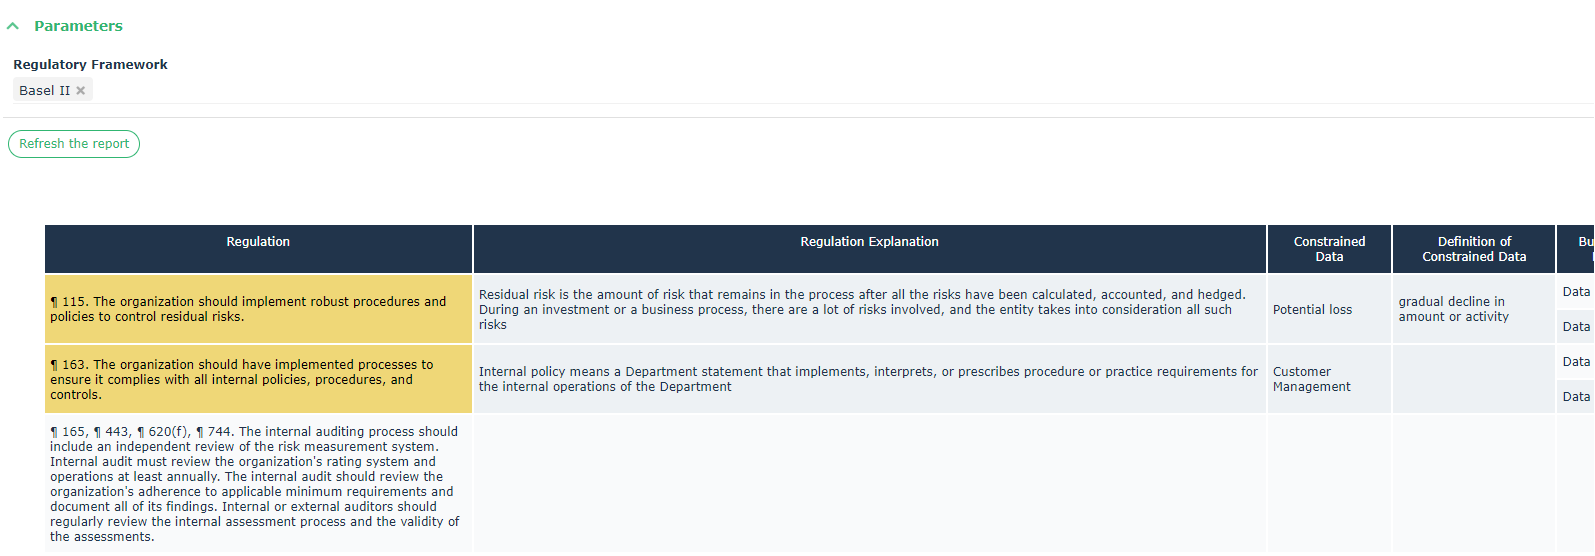
Report parameters
This consists of defining report input data.
Parameter | Object type |
|---|---|
Regulatory Framework List | Regulatory Framework |
Rules Report
This type of report allows you to select a set of rules (business, operational or system) and view in tabular form the regulations they implement.
Data Catalog Reports
Data Catalog Report
The data catalog report is used to analyze the content of one or more data catalog(s). It presents the following chapters:
• Organizations at stake: entities that use or consume the data in the catalog.
• Regulatory Frameworks and Business Policy Frameworks
• Categories/Sections
Data Quality Report
This report presents the quality of information area data along dimensions such as consistency, accuracy, etc.
See also: Quality Dimensions.