Report Template Introduction
A Report Template describes how to build a report.
Predefined Report Templates are provided with HOPEX. Each Report Template is specific to a HOPEX Solution (e.g.: Risk analysis).
With HOPEX Report Studio (and HOPEX Studio) you can create your own Report Templates.
Report Template creation is performed in both HOPEX Windows Front-End and Web Front-End for users with HOPEX Customizer or HOPEX Customizer Publisher profile.
Once a Report Template is created, any user can use it to query HOPEX repository and create a report. Data first shown in list form can then be handled and shown in graphical format using Instant Report feature.
Dynamic reports enable to analyze repository data through different focus.
Each report is built from a Report Template, which defines parameters on which is based the report. Creation and use of reports is available for all users.
Report Template and Report Chapters
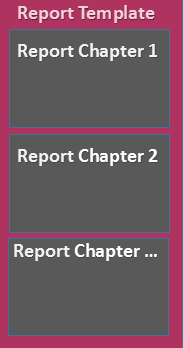
A Report Template is made up of at least one Report Chapter. The Report Template defines:
• each Report Chapter
• (if needed) report parameters.
Report Chapter and Macro or Report Data Views
The Report Chapter creation is based on either:
• a macro, or
• Reports Data View(s)
A single Report Template can include both types of Report Chapters.
Report Chapter and macro
The Report Chapter creation can be based on:
• a macro, which refers to Java code that implement dedicated interfaces
and
• if needed Report Parameters
Parameter definition indicates the input data type the user must enter for the report calculation (e.g.: Applications).
For examples of Report Templates based on a macro see for example Report Templates > HOPEX > MEGA folder.
Report Chapter and Report Data Views
The Report Chapter creation can be based on:
• a Report Data View.
The Report Data View is included in a Report Container.
• a set of Report Data Views.
Each single Report Data View is included in a single Report Container.
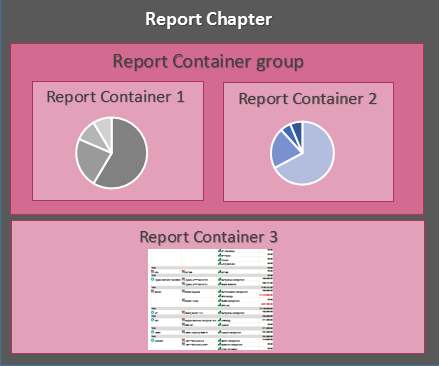
You can add a set of Report Containers in a Report Chapter.
By default the Report Containers are displayed in a single column. You can modify the display of the Report Containers (e.g.: on a same row, in separate tabs) through the Report Container group.
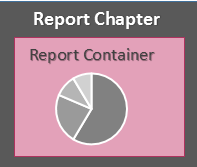
A Report Chapter may include:
• at least one Report Container including a single Report Data View.
• several Report Containers, which can be grouped in Container Groups, so that the Report Data Views are displayed for example on the same row.
Example 1: a Report Chapter with its Report Data Views displayed in a single column.
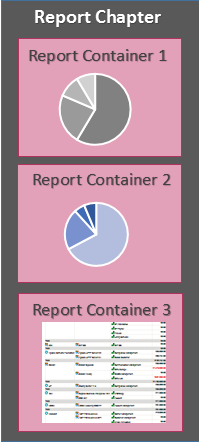
Example 2: a Report Chapter with its first two Report Data Views displayed on the same row.
Report Data View types
The Report Data View types are:
• Table (Report Table View)
A Report Table View is built from a set of columns of a Report DataSet, which defines the set of columns of the table.
• Matrix (Report Matrix View)
A Report Matrix View is built from three columns of a Report DataSet:
• two columns to define the matrix axes,
• a third column to define the cells.
• Graph (Report Graph View)
A Report Graph View is built from data provided by a Report Data Source of GraphSet Definition type.
• Tree (Report Tree View)
A Report Tree View is built from data provided by a Report Data Source of TreeSet Definition type.
• Value (Report Value View)
A Report Value View is built from data provided by a Report Data Source of query type.
Available displays depend on the Data View type.
Report Style
You can define the style of the reports generated from a Report Template at Report Template level with a Report Style. In that case the style applies to all the chapters of the report.
You can also apply:
• a general style at Report Data View level.
• a conditional style at Report Data View element level.
Report Renderer
The renderer defines how the dataset is displayed in the report.
Depending on the Report Data View, the following specific renderers are available:
• Report Matrix View:
• matrix and associated bar chart
• matrix and associated radar chart
• Report Table View:
• radar chart
• line chart
• bar chart
• pie chart
• gauge
• word cloud
• table
• Report Graph View:
• graph
• Report Tree View:
• Breakdown
• Dendrogram
• TreeMap
• TreeTable
• Report Value View:
• gauge
Report renderer parameters
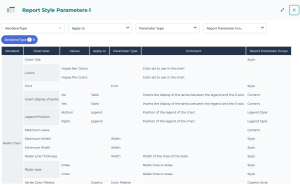
From the Reports navigation menu, use the "Report Style Parameters" Report Template to create a report displaying for each renderer type, all its available parameters and where they are used. Use the filters to narrow down the display.
Example: in the RendererType filter select "Radar chart" to display the radar chart renderer information only.