3. CIO Dashboard
3.1. Implementation
Apart from the Application Obsolescence (HOPEX360_CIO_Dashboard_V2_Application_Obsolescence) , the CIO Dashboards are implemented as follows:
o For the configuration
o A HOPEX descriptor is built using standard HOPEX technology but calls the following item.
o a JS Macro within HOPEX, this is where the translation and the customization need to take place
o During the generation, there are 2 steps:
o the descriptor generates the html pages that has a reference to a JSON file.
o the aforementioned JSON file is generated by the JS Macro and contains the relevant data to display the dashboard.
Here is a list of the key components underneath the dashboards:
|
Dashboard
|
HOPEX Descriptor
|
Generated html page
|
JS Macro
|
Generated JSON (located in JSON folder)
|
|
Applications
|
HOPEX360_CIO Dashboard_V2_Applications
|
C6D1CA84602F44D1.htm
|
Applications Dashboard
|
C6D1CCBB602F7983_dashboard.JSON
|
|
Technologies
|
HOPEX360_CIO Dashboard_V2_Technologies
|
C6D1CAA2602F4568;htm
|
Technologies Dashboard
|
C6D1CCF7602F79D9_dashboard.JSON
|
|
BCM
|
HOPEX360_CIO Dashboard_V2_Application_Business Rationalisation_Box-in-Box
|
C6D1CB10602F460F.htm
|
Application Business Rationalisation Dashboard
|
C6D1CD0A602F7A02_dashboard.JSON
|
|
FM
|
HOPEX360_CIO Dashboard_V2_Application_Functional Rationalisation_Box-in-Box
|
C6D1CB2B602F46B6.htm
|
Application Functional Rationalisation Dashboard
|
C6D1CD14602F7A2B_dashboard.JSON
|
|
TFM
|
HOPEX360_CIO Dashboard_V2_Technology_Functional Rationalisation_Box-in-Box
|
C6D1CB43602F474B.htm
|
Technology Functional Rationalisation Dashboard
|
C6D1CD23602F7A54_dashboard.JSON
|
3.2. Application
3.2.1. Filters
All the widgets shown on this page are filtered by 4 options:
• Current Date: this allows to analyse how the dashboard looks like over time
• Lifecycle State: this allows to only display the Applications in a particular state (Production, Preparation, Retirement)
• Support State: this allows to only display the Applications based upon their support state (General support, Extended support, no longer supported)
• By Portfolio: this allows to filter the Applications by Portfolio
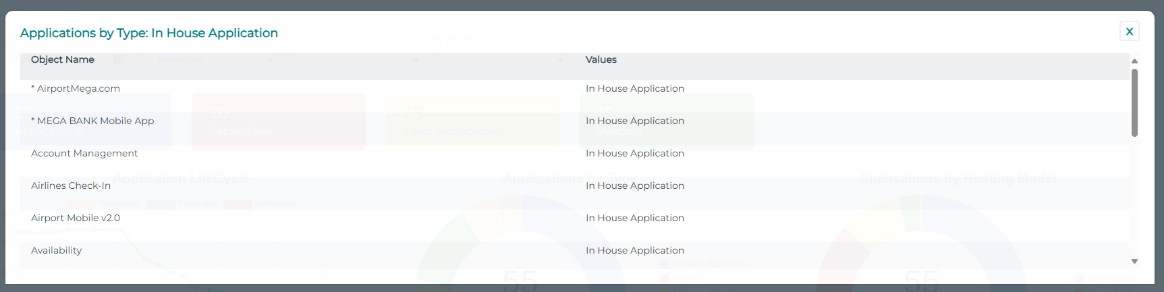
3.2.2. Drill down
On click, all the widgets can be drilled down. A detailed table will pop up over the page, as shown below.
3.2.3. Indicators
• Applications
|
|
Key information
|
|
Purpose
|
This widget shows the number of Applications in the selected Portfolio
|
|
Data structure
|
- (optional) Portfolio
- Application
|
|
Example
|
 |
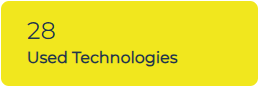
• Obsolete Applications
|
|
Key information
|
|
Purpose
|
This widget shows the number of Technologies used by the Applications of the selected Portfolio. This is the list of Technologies used by at least one Application of the Portfolio.
|
|
Data structure
|
- (optional) Portfolio
- Application
- Technology
|
|
Example
|
 |
• Capabilities
|
|
Key information
|
|
Purpose
|
This widget shows the number of Capabilities supported by the Applications of the selected Portfolio. This is the list of Capabilities linked to at least one Application of the Portfolio.
|
|
Data structure
|
- (Optional) Portfolio
- Application
- Business Capability
|
|
Example
|
 |
• Vendors
|
|
Key information
|
|
Purpose
|
This widget shows the number of Vendors providing Technologies supporting the Applications of the selected Portfolio. This is the list of Org Units typed as Vendor linked to at least one Technology supporting at an Application of the Portfolio.
|
|
Data structure
|
- (Optional) Portfolio
- Application
- Technology
- Vendor
|
|
Example
|
 |
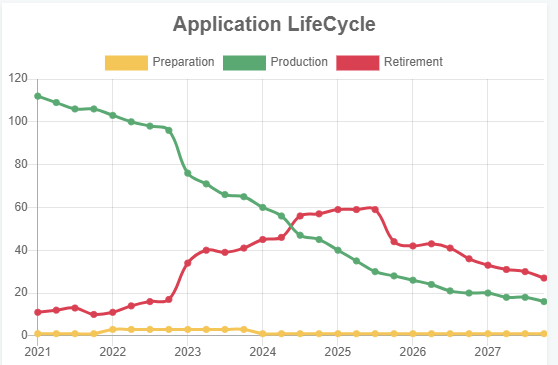
3.2.4. Application LifeCycle
|
|
Key information
|
|
Purpose
|
This shows the number of Applications by state over time for the selected perimeter(s)
|
|
Data structure
|
- (optional) Portfolio
- Application
- Object Life
- Time Periods
|
|
Example
|
 |
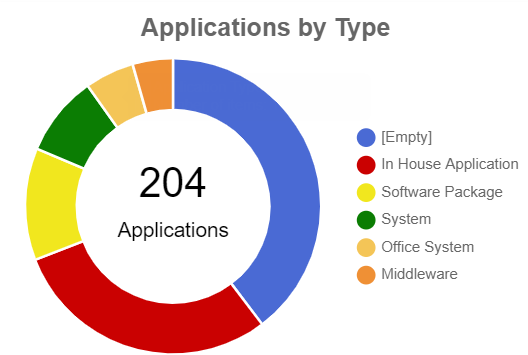
3.2.5. Application By Type
|
|
Key information
|
|
Purpose
|
This shows the number of Applications by Type of Application
|
|
Data structure
|
- (optional) Portfolio
- Application
- Application Type (System, In House, Software Package..)
|
|
Example
|
|
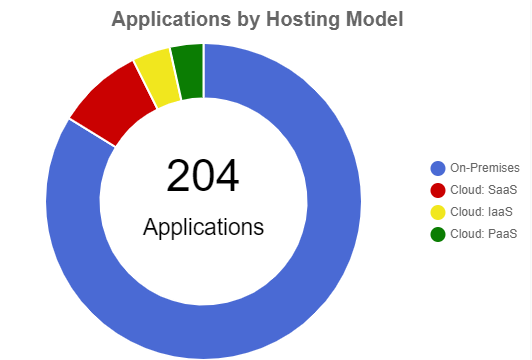
3.2.6. Application By Hosting Model
|
|
Key information
|
|
Purpose
|
This shows the number of Applications by Hosting Model of Application
|
|
Data structure
|
- (optional) Portfolio
- Application
- Application Hosting Model (On Premises, Saas, Iaas, Paas
|
|
Example
|
 |
|
Example
|
|
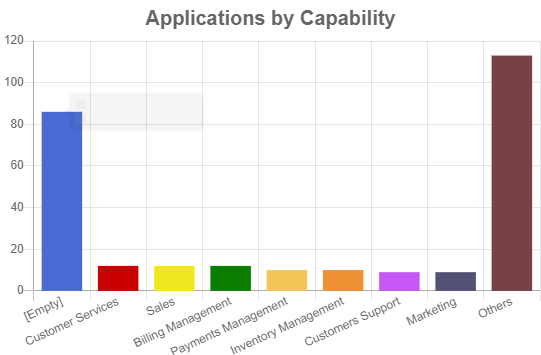
3.2.7. Application By Capability
|
|
Key information
|
|
Purpose
|
This shows the number of Applications by Fulfilled Capabilities
|
|
Data structure
|
- (optional) Portfolio
- Application
- Capability
|
|
Example
|
 |
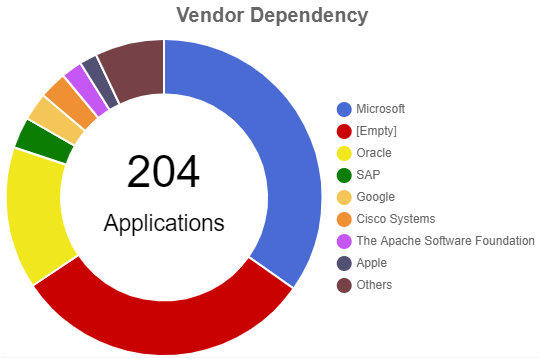
3.2.8. Vendor Dependency
|
|
Key information
|
|
Purpose
|
This shows the number of Applications by Vendor
|
|
Data structure
|
- (optional) Portfolio
- Application
- Technology to Org-Unit typed Vendor
|
|
Example
|
 |
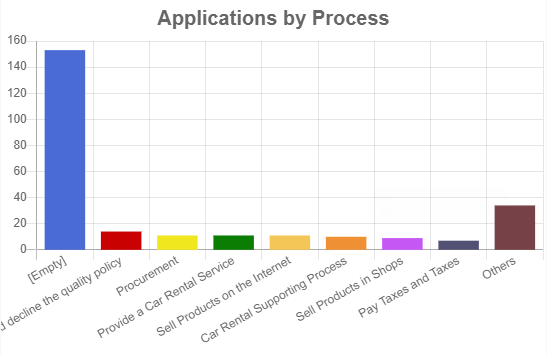
3.2.9. Applications by Process
|
|
Key information
|
|
Purpose
|
This shows the number of Applications by Process Categories
|
|
Data structure
|
- (optional) Portfolio
- Application
- Process Category
|
|
Example
|
 |
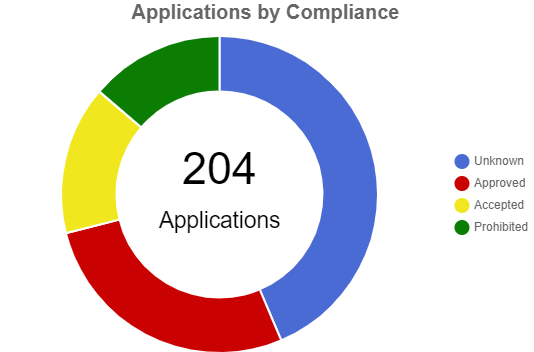
3.2.10. Application Compliance
|
|
Key information
|
|
Purpose
|
This shows the number of Technologies supporting Applications of the selected perimeter(s) broken down by Company Standard
|
|
Data structure
|
- (optional) Portfolio
- Application
- Technology – Company Standard
|
|
Example
|
 |
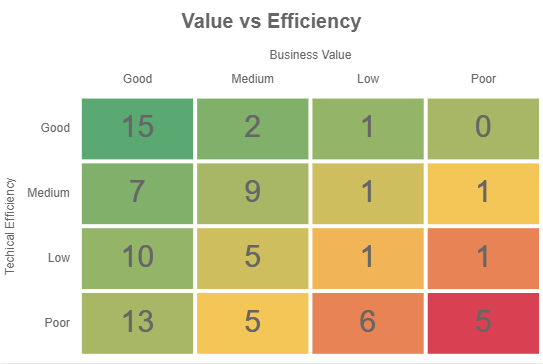
3.2.11. Value vs. Efficiency
|
|
Key information
|
|
Purpose
|
This shows a clickable Heatmap of Applications highlighting their Value and Efficiency
|
|
Data structure
|
- (optional) Portfolio
- Application
- Value
- Efficiency
|
|
Example
|
 |
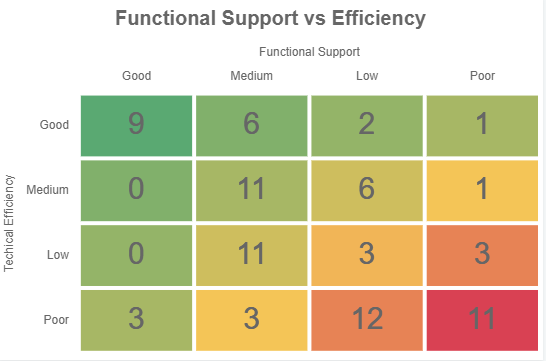
3.2.12. Functional Support vs. Efficiency
|
|
Key information
|
|
Purpose
|
This shows a clickable Heatmap of Applications highlighting their Functional Support and Efficiency
|
|
Data structure
|
- (optional) Portfolio
- Application
- Functional Support
- Efficiency
|
|
Example
|
 |
3.3. Technologies
3.3.1. Filters
All the widgets shown on this page are filtered by 4 options:
• Current Date: this allows to analyse how the dashboard looks like over time
• Lifecycle State: this allows to only display the Technologies in a particular state (Production, Preparation, Retirement)
• Support State: this allows to only display the Technologies based upon their support state (General support, Extended support, no longer supported)
• By Portfolio: this allows to filter the Technologies by Technology Portfolio
3.3.2. Drill down
On click, all the widgets can be drilled down. A detailed table will be pop up over the page, exactly as the Applications Dashboard.
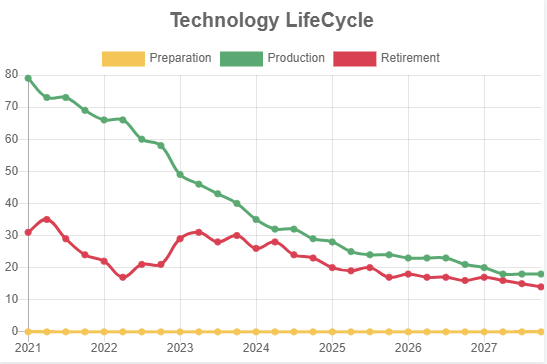
3.3.3. Technology LifeCycle
|
|
Key information
|
|
Purpose
|
This shows the number of Technologies by state over time for the selected perimeter(s)
|
|
Data structure
|
- (optional) Portfolio
- Technology
- Time Period
|
|
Example
|
 |
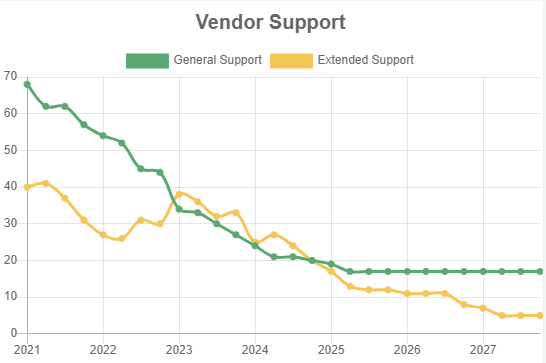
3.3.4. Vendor Support
|
|
Key information
|
|
Purpose
|
This shows the Technologies Support State over time
|
|
Data structure
|
- (optional) Portfolio
- Technology
- Time Period and Support dates
|
|
Example
|
 |
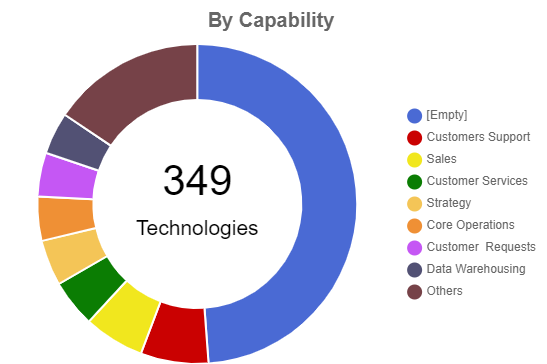
3.3.5. By Capability
|
|
Key information
|
|
Purpose
|
This shows a pie chart of Technologies groups by supported Capabilities
|
|
Data structure
|
- (optional) Portfolio
- Technology
- Application
- Business Capability
|
|
Example
|
 |
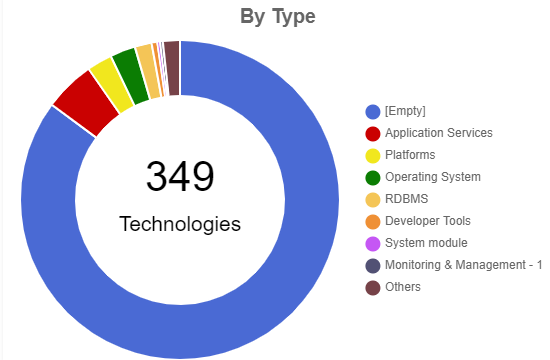
3.3.6. By Type
|
|
Key information
|
|
Purpose
|
This shows a pie chart of Technologies grouped by Type
|
|
Data structure
|
- (optional) Portfolio
- Software Technologies
- Technology Type
|
|
Example
|
 |
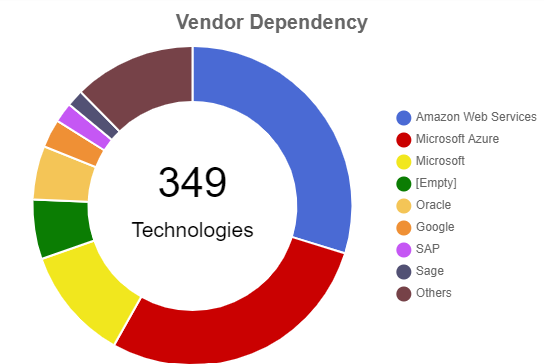
3.3.7. Vendor Dependendy
|
|
Key information
|
|
Purpose
|
This shows the Technologies grouped by Vendor
|
|
Data structure
|
- (optional) Portfolio
- Technology
- Org Unit typed Vendor
|
|
Example
|
 |
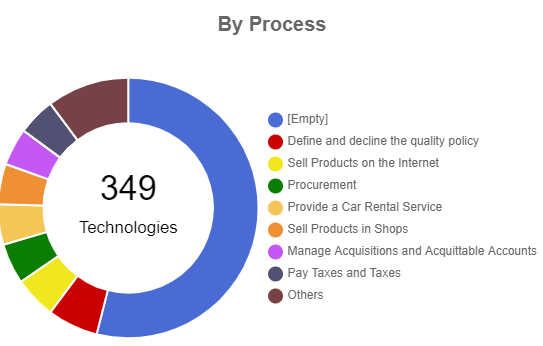
3.3.8. By Process
|
|
Key information
|
|
Purpose
|
This shows a pie chart of Technologies grouped by Process they support via Application
|
|
Data structure
|
- (optional) Portfolio
- Process Category
- Application
- Software Technology
|
|
Example
|
 |
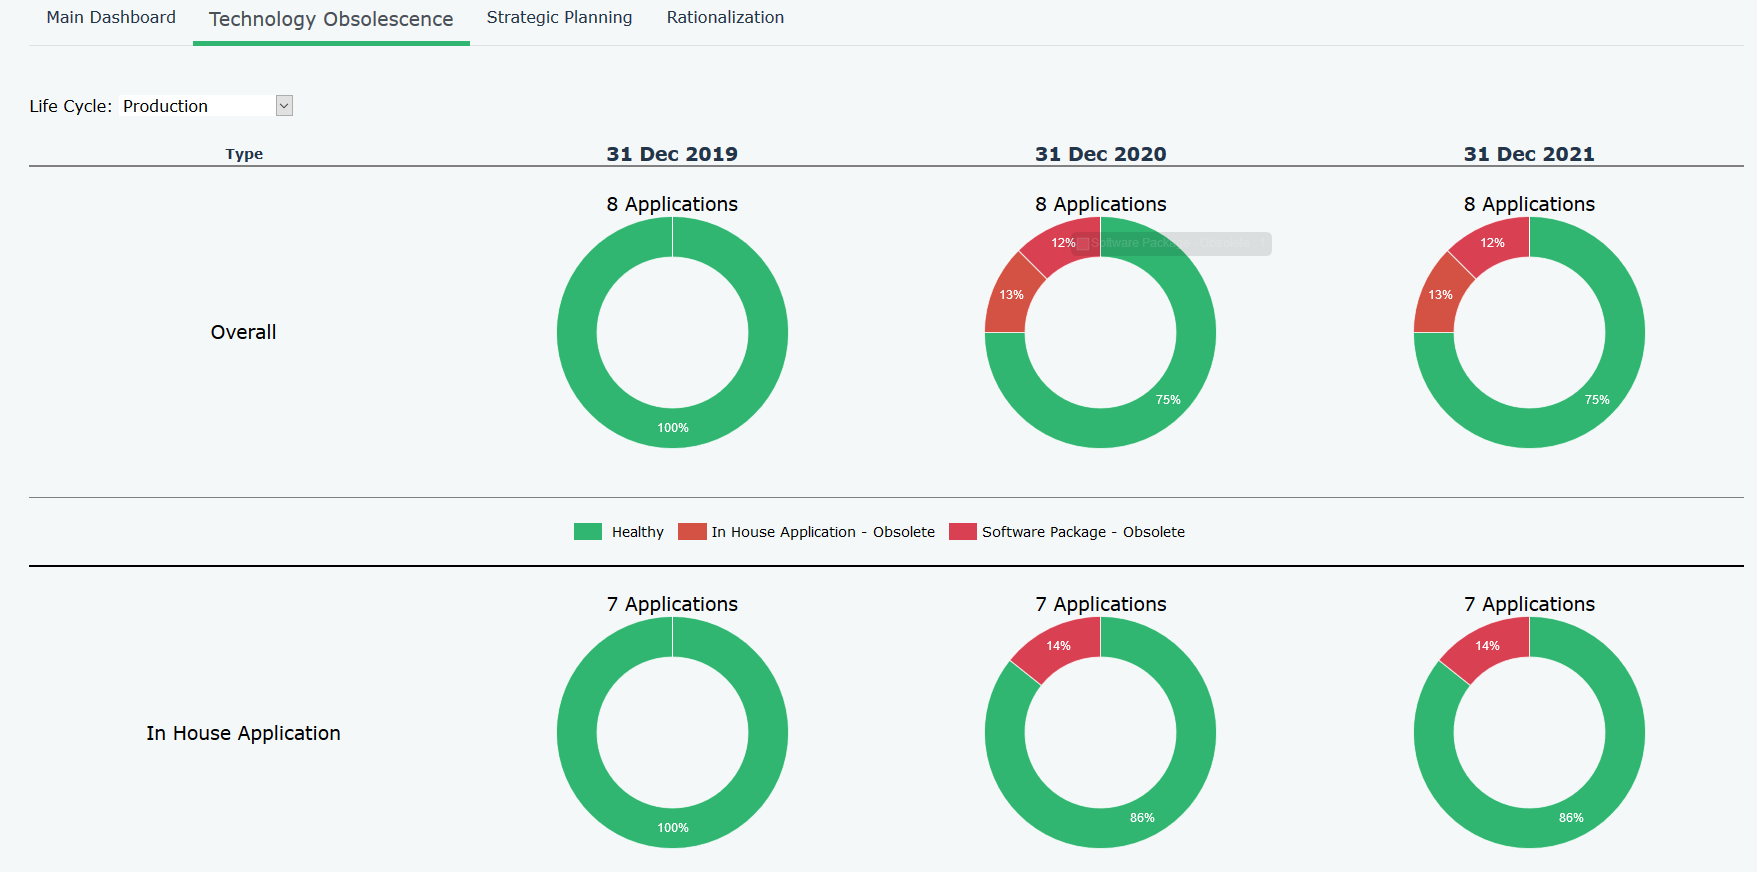
3.4. Technology Obsolescence
|
|
Key information
|
|
Purpose
|
Shows the number of Applications by Technology Obsolescence, which
|
|
Filter
|
Lifecycle status
|
|
Source JSON file
|
None. The data is generated within the Hopex Descriptor
|
|
Data structure
|
- Application – Application Type
- Object Lifecyle - Time Period
- Technology – End of Support / End of Extended Support
Logic: At a given point in time, if a Technology linked to a given Application is no longer supported, then this Application is obsolete
|
|
Example
|
 |
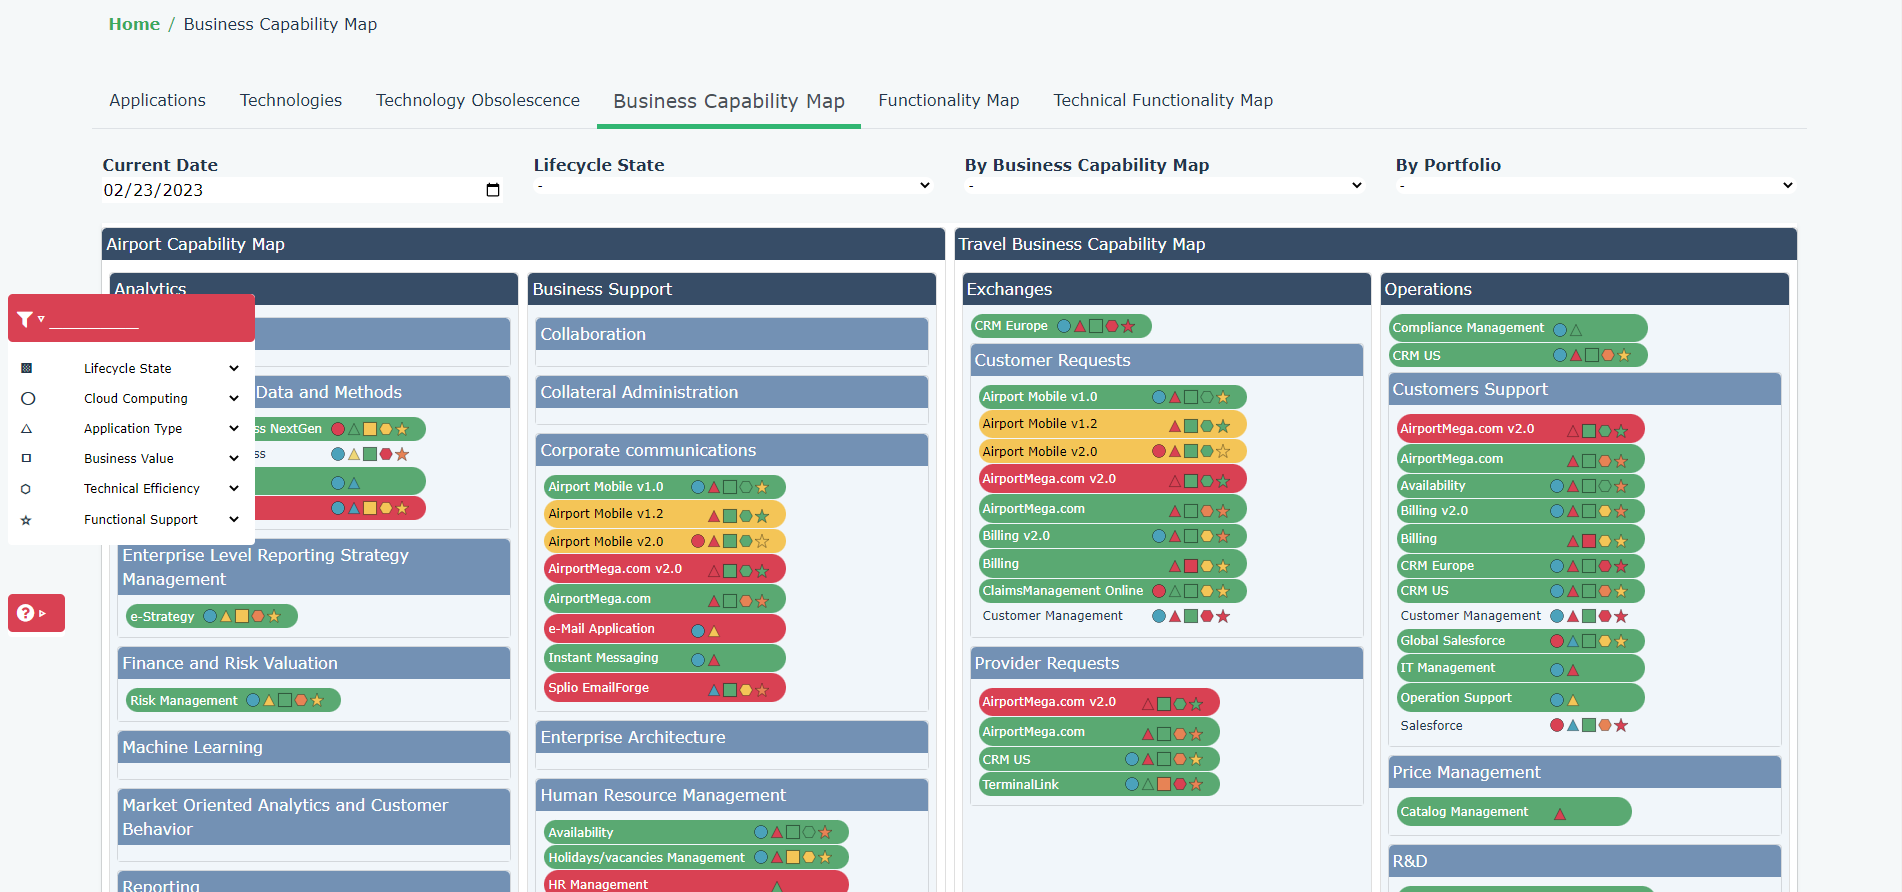
3.5. Business Capability Map
|
|
Key information
|
|
Purpose
|
This is a graphical view of the Business Capability Map hierarchy and their supporting Applications
|
|
Filter
|
4 filters are available:
- Current Date
- Lifecyle State: to filter Applications
- By Business Capability Map: Business Capability Map allows to switch from one to another
- By Portfolio: to filter Applications
-
On the left-hand side, a toolbox allows to colour code the Applications based upon their characteristics
|
|
Data structure
|
- Business Capability Map
- Business Capability and their Components to the 4th level
|
|
Example
|
 |
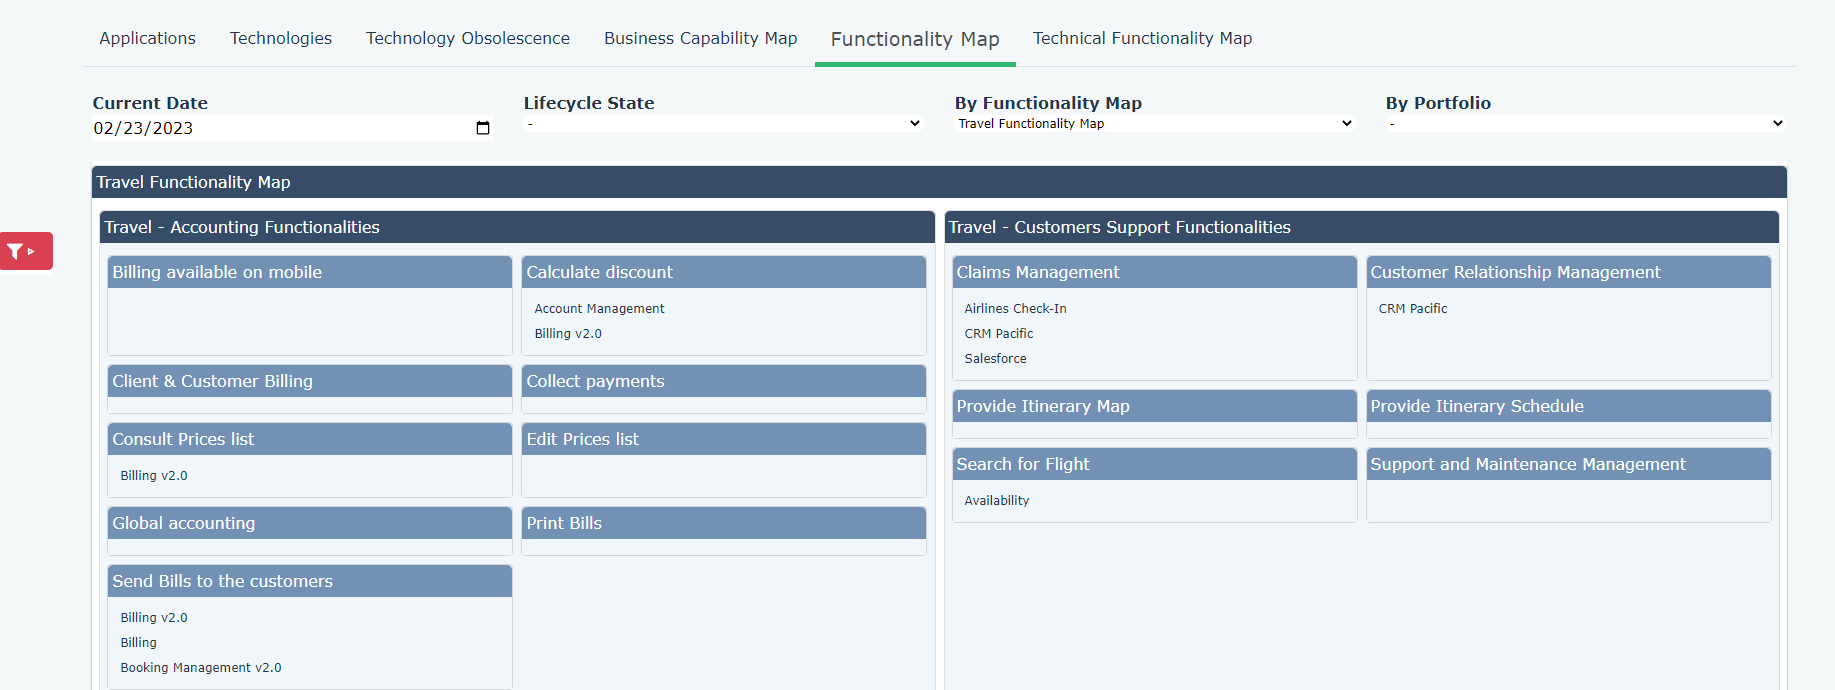
3.6. Functionality Map
|
|
Key information
|
|
Purpose
|
This is a graphical view of the Functionality Map hierarchy and their supporting Applications.
|
|
Filter
|
4 filters are available:
- Current Date
- Lifecyle State: to filter Applications.
- By Functionality Map: Functionality Map allows to switch from one to another.
- By Portfolio: to filter Applications.
On the left-hand side, a toolbox allows to colour code the Applications based upon their characteristics
|
|
Data structure
|
- Functionality Map
- Functionality and their Components to the 4th level
|
|
Example
|
 |
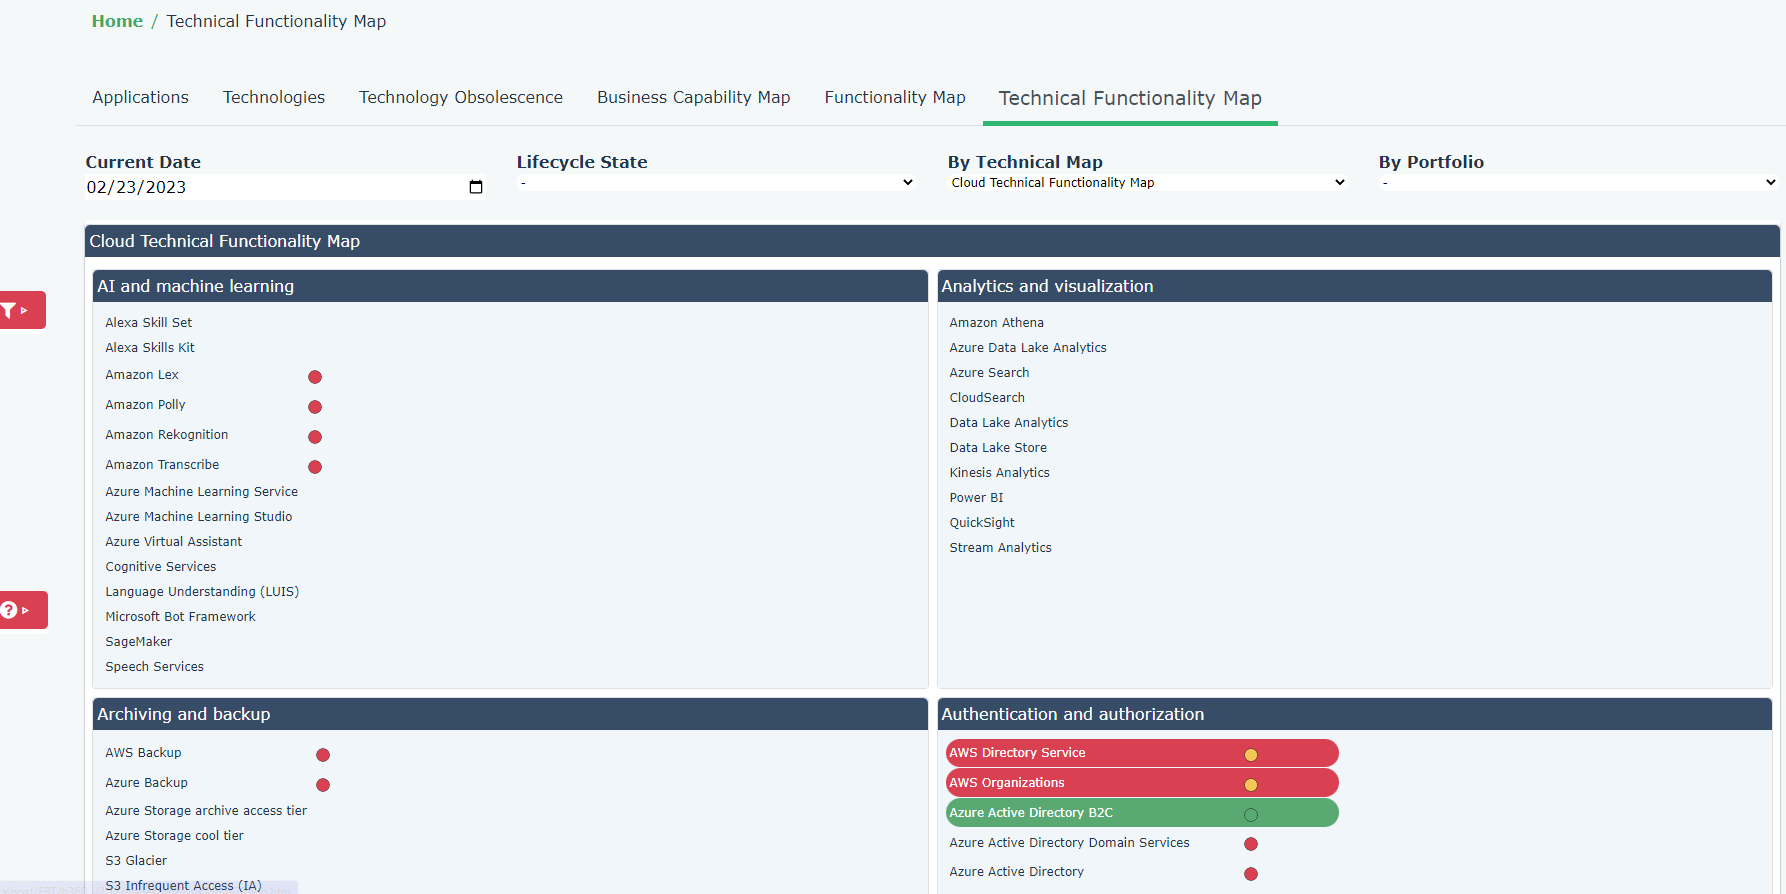
3.7. Technical Functionality Map
|
|
Key information
|
|
Purpose
|
This is a graphical view of the Technical Functionality Map hierarchy and their supporting Technologies
|
|
Filter
|
4 filters are available:
- Current Date
- Lifecyle State: to filter Software Technologies.
- By Technical Functionality Map: Technical Functionality Map allows to switch from one to another.
- By Portfolio: to filter Software Technologies.
On the left-hand side, a toolbox allows to colour code the Software Technologies based upon their characteristics
|
|
Data structure
|
- Technical Functionality Map
- Technical Functionality and their Components to the 4th level
|
|
Example
|
 |