Business Capabilities Reports
Dynamic reports enable you to analyze the business capabilities of your repository according to different perspectives.
Business Capability Map Breakdown Report
You can use a breakdown report to visualize the objects that make up a business capability map and the realization of capabilities by EA equipment.
This report is available in the Business Capabilities Properties Reports page.
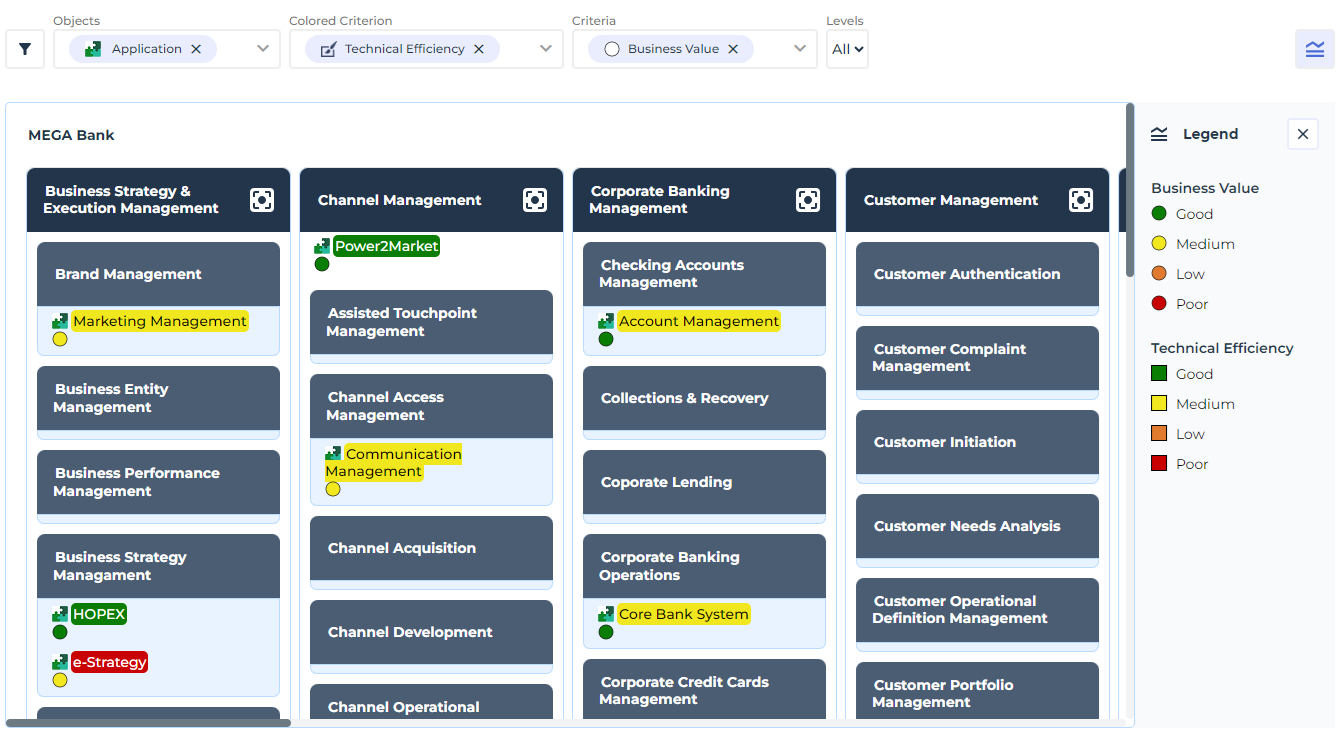
Example
The example below shows the coverage of the business capability map by applications, with the “Technical efficiency” and “Business value” criteria available on the applications.
Business Capability Coverage over Time
This report provides a temporal representation of the elements that make up a business capability map and the applications or application systems that cover them.
Applications are analyzed according to various possible criteria. A timeline shows their evolution over several years.
The criteria selected applies to both views of the report:
• Capabilities Time analysis: a treemap displays the various business capabilities and the applications that cover them.
• Criteria Time Analysis: a table displays the values of the selected indicators according to the dates indicated.
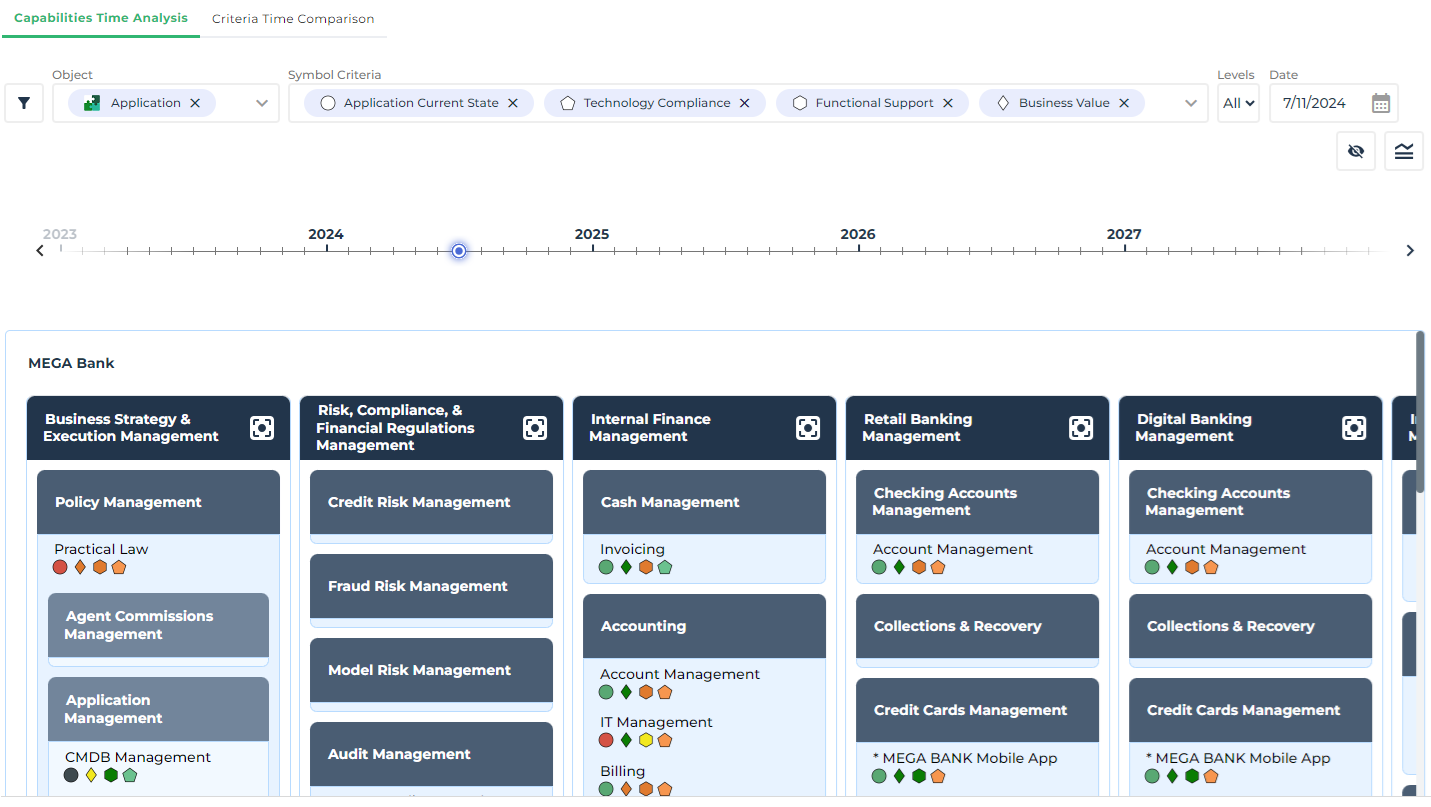
Example
Below is the coverage report for the “MEGA Bank” capability map.
The report displays the list of associated applications and the criteria selected (Current state, Technology compliance, Functional support, Business value).
A point on the timeline indicates the date of the values displayed in the report. You can move this point to view the evolution of indicator values over time.
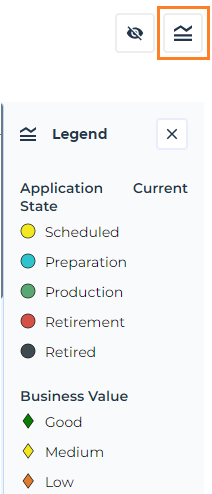
A Legend button shows the meaning of the indicators and their colors.
Launch the report
To generate a Business Capability Coverage over Time report:
1. Click the Reports menu.
2. To the right of the edit area, click the Create a report button.
3. Find the “Business Capability Coverage over Time” report template.
4. Select the report type and click Create a report.
The report creation wizard opens.
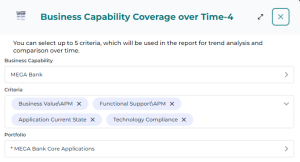
5. Select:
• the business capability map
• the analysis criteria
• if required, the portfolio of applications to be evaluated.
6. Click Preview then Continue.
7. Give the report a name and a description.
8. Click Save and open.
Business Capabilities Tree Map
This report breaks down a capability tree in the form of a treemap according to one of three possible criteria:
• Number of components: the surface area is proportional to the number of sub-capabilities in the tree.
• Application ratio: the surface area is proportional to the realization percentage of the current capability by applications.
• Cost of applications: the surface area is proportional to the cost of applications realizing current and descendant capabilities in the tree.
Take note that:
• Since an application can realize several capabilities, the "Cost Contribution Key" ratio is applied to the criteria "Application ratio" and "Cost of Applications".
• An application realizing an "intermediate" capability (i.e. not a leaf of the tree) is considered to realize all its sub-capabilities in a uniform way (strict pro rata between all sub-capabilities).
To generate the business capability map breakdown from an application portfolio:
1. Open the properties of the portfolio in question.
2. Click Reporting > Business Capability Tree Map.
3. Select a capability map.
4. Refresh the report.