Handling a Breakdown Report
A breakdown report can be specialized and adapted to each Solution specific needs.
This type of report enables to display the breakdown of an “Architecture Building Block” type root object (e.g.: Capability map) into sub-objects of different types and analyze their fulfillment by “Solution Building Block” type objects (e.g.: Application).
The Report Template showing a breakdown map is based on:
• a root object
• analysis criteria (on each breakdown level)
You can:
• display or hide:
• some object types
• some analysis criteria
• filter:
• the report display according to specific criteria values
• the items of a breakdown level using a predefined query
• display all the items of the components that include more than 10 items
• modify the display:
• modify the number of displayed levels
• zoom in on a component
• customize the display:
• display the object icons
• modify the number of levels displayed at opening
• modify the column width
• display an object properties (component or item)
• view the report data values at another date (report with time line)
You can also modify the report input parameters:
• add or remove object types
• add or remove analysis criteria
• Modify criterion appearance (background color or symbols)
E.g.: to highlight a criterion (background color), see Highlight a criterion.
Zooming in a breakdown report
To zoom in on a component:
1. In the breakdown report, to the right of the component, click  .
.
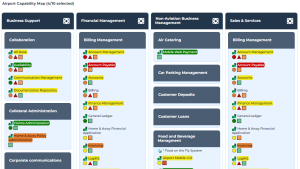
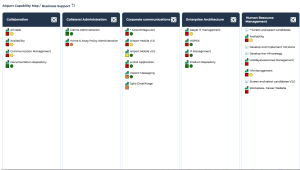
.E.g.: in the airport capability map, you can zoom in the “Business Support” Business Capability.
The report breadcrumb trail indicates that your are one lower level down.
The component selected widens over the whole space of the breakdown map and displays its components, its elements and analysis criteria.
2. You can move down in the map levels, as long as the component includes components.
 .
.Customizing a breakdown report display
By default, all levels and all object types are displayed at report opening. If needed, you can reduce the report content display at report opening:
• define the object types displayed at opening
• define the number of levels displayed at opening
In a breakdown report, you can display object icons:
• component icons
E.g.: icons of the Business Capacity Map  and icons of its Business Capacities
  .
.
and icons of its Business Capacities .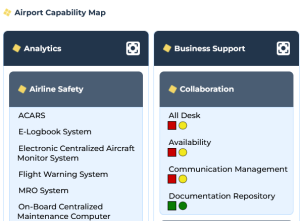
• icons of the items (default configuration)
E.g. : Application  and Application System
  icons.
and Application System icons.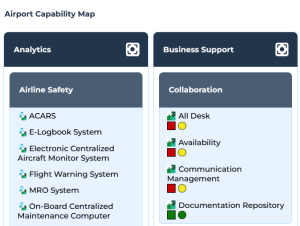
• both component and item icons
E.g.: icons of the Business Capacity Map and icons of its Business Capacities , as well as Application and Application System icons.
and icons of its Business Capacities , as well as Application and Application System icons.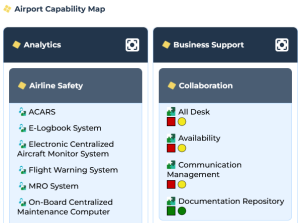
You can increase (or reduce) the column minimum width.
To modify the breakdown report display:
1. Edit the breakdown report (click More  > Edit Report
  ).
).
> Edit Report ).The edit pane appears to the right.
2. In the Content section, modify the relevant parameter value:
• Display all Object Types at opening
• Level number at opening
3. In the Style section, modify the relevant parameter value:
• Show Component Icons
• Show Item Icons
• Column Minimum Width
4. Click Apply.
Hiding object types an/or criteria
In a breakdown report, you can:
• hide or display certain object types
• hide or display certain criteria
In the report toolbar:

• in the Object Types field:
• click the cross  of the object type to hide.
of the object type to hide.Ex. : hide Process.
• click the drop-down arrow then each object type to display.
• in the Symbol Criteria field:
• click the cross of the criterion to hide.
of the criterion to hide. • click the drop-down arrow then each criterion to display.
E.g.: display “Obsolescence Risk” and “Technical Efficiency”, and hide “Business Value” and “SLA level”.
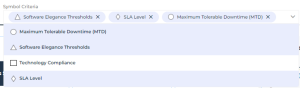
Only the evaluated criteria are available in the drop-down list.
To find out the available criteria that are not evaluated, hover the mouse over  of Symbol Criteria.
of Symbol Criteria.Highlight a criterion
The breakdown report may include:
• several symbol criteria
• one color criterion
The color criterion highlights a criterion.
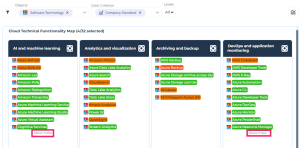
E.g.: the “The Cloud Technical Functionality Map” breakdown report highlights the “Company Standard” criterion of the Technologies.
At breakdown report creation, you can choose the Color Criterion to highlights a criterion.
With specific reports, you can modify the criterion style: switching from Symbol Criterion to Color Criterion to highlights the criterion.
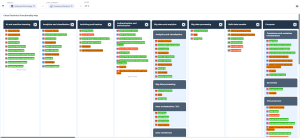
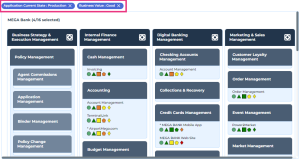
Displaying all items
To facilitate the reading, a component displays a maximum of 10 items.
You can display all the items of:
• a specific component
• all the components
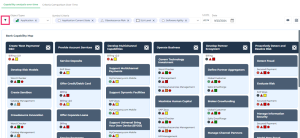
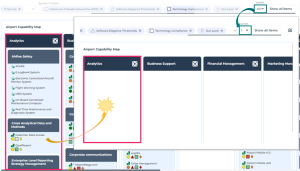
E.g.: here two of the components include more than 10 items. Show more is available at the bottom of their item lists.
To display more items:
• on a specific component: at the bottom of the item list, click Show more.
Only the component displays all of its elements.
• on all of the components at once: in the report toolbar click Show Filters  , select Show all items.
, select Show all items.All of the components display all their items.
Filtering (root columns, criteria)
By default all of the root components (columns) and all of the criteria are displayed.
• To analyze one or more specific components, you can filter the others.
• You can also filter the items according to specific values of certain criteria.
For each filter you can select one or more values. The result must contain at least one of the values of each filter.
The number of values selected for each filter is indicated at each filter level.
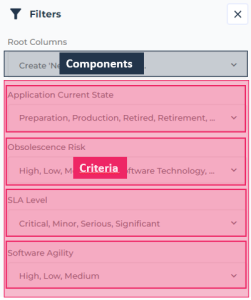
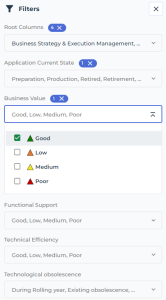
To filter the display according to specific components and specific criteria:
1. In the report toolbar, click Show Filters .
.
The Filters pane includes:
• a filter on components: the root columns
• as many filters as criteria
2. To filter the report according to certain components: in the Root Columns, click the drop-down menu and select the components to display.
Enter characters in the field: as you enter characters the list narrows down.
The number of components selected is displayed to the right of the Root Columns filter.
E.g.: filter on four components.
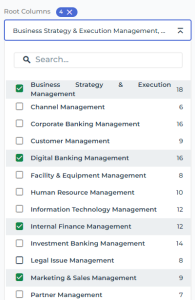
The report is automatically filtered on the selected components.
E.g.: four components out of ten are displayed.
3. (Optional) To fold the filter, click  .
.
.4. To filter the items according to certain criterion values: in the <Criterion name> field, click the drop-down menu and select the values you want to apply to the filtering.
You can add to the filtering as many values on as many criteria you want.
The number of values selected is displayed beside the filter name.
E.g.: filter on the “Production” Current state and “Very high” Obsolescence Risk criteria.
The report displays only the items that match at least one of the filtering criteria.
The filtering is indicated at the top of the report: the criterion and its value.
 .
.
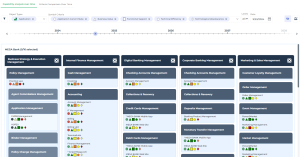
Handling data over time
With certain breakdown reports you can track data value evolution over time.
These reports include in their toolbar:
• a date field indicating the date of the displayed data values
At opening, the report displays the data values at the current date.
• a time line with a dot cursor enabling to change the date of the displayed data
E.g.: the Business Capability Coverage over Time report.
To track indicator value evolution over time:
The values of the criteria are updated according to the selected date.
In the report toolbar, the date field indicates data display date.
To Show/Hide the timeline, click Show/Hide Timeline  .
.
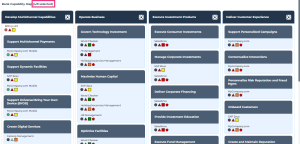
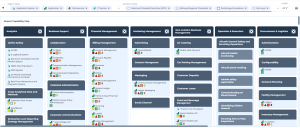
.Example of a Report Template showing a breakdown map
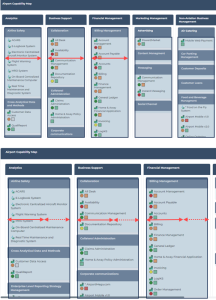
The “Building Block Breakdown Report” shows a breakdown map.
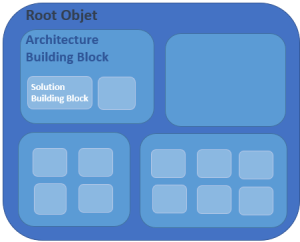
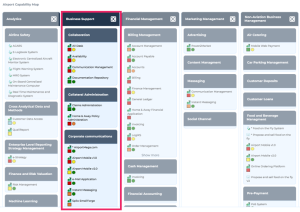
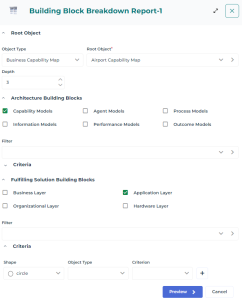
The “Building Block Breakdown Report” report template details the breakdown of a Root Object (e.g.: the “Airport Capability Map” Business Capability Map) according to selected classifier objects:
• Architecture Building Blocks
E.g.: Capability Models.
• Fulfilling Solution Building Blocks
E.g.: Application layer.
For each building block, you can add:
• a content filter (using a query)
Examples:
The “Capabilities with fulfilling solutions building blocks” filter, which you can add to the Architecture Building Blocks, enables to display only capabilities fulfilled by applications (Solution building blocks).
The “Applications in production” filter, which you can add to the Fulfilling Solution Building Blocks, enables to display only the applications that are in production.
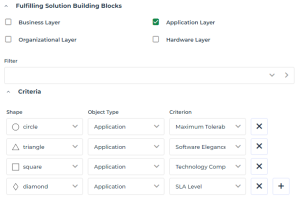
• analysis criteria and choose their associated symbols (shapes)
Examples:
The circle shows the “Maximum tolerable downtime” of an Application.
The triangle shows the “Software Elegance Thresholds” of an Application.
The square shows the “Technology Compliance” of an Application.
The diamond shows the “SLA level” of an Application Service.
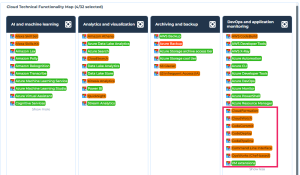
To configure a breakdown map display:
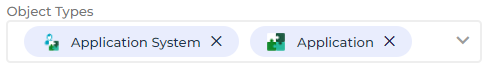
• To modify the object types for which to display analysis criteria, in the Object Types field:
• click the cross of the object types you do not want to display.
of the object types you do not want to display. • click the drop-down arrow and select the object types to display.
E.g.: you can display only the Applications and Application Systems.
• To lighten a breakdown map display, in the Levels field, select an upper level.
Lower levels are hidden.
• To view the values of the analysis criteria, click Show/Hide Legend  .
.
. again.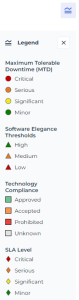
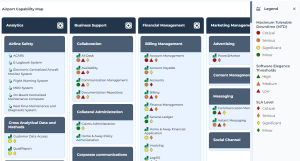
• To modify the analysis criteria displayed in the report, in the Symbol Criteria field:
• click the cross of the criterion to hide
of the criterion to hide E.g.: “Technology Compliance".
• click the drop-down arrow and select the criterion to display.

The legend details only the criteria displayed.
• To add an analysis criterion, click Edit Parameters  and in the Criteria section:
and in the Criteria section:• Click Add Criterion  .
.
.• In the Shape column, select the symbol associated with the criterion, or select “Fill Color” to highlight this criterion (adding background color to the name of the object).
E.g.: Fill Color.
• In the Object Type column, select the type of object bearing the analysis criterion.
E.g.: Application.
• In the Criterion column, select the object parameter. The values of this parameter are represented by colors.
E.g.: Application technical efficiency.
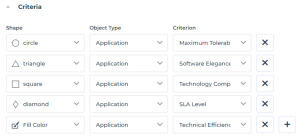
• Click Apply.
The parameter is added to the legend.
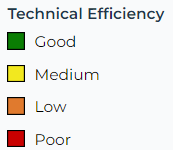
If you chose the “Fill color” criteria, object names have as background color the color that represents the value of the criterion selected.
E.g.: The application name has as background color its technical efficiency level value.