Analyzing an Inventory Portfolio
HOPEX IT Portfolio Management provides predefined report templates for application portfolio analysis.
Reports Embedded in a Portfolio
The different report templates proposed as standard by HOPEX IT Portfolio Management are designed to compare initiatives of a portfolio based on specific criteria. Different report types offer different analysis possibilities.
These reports are based on information provided by the application owners. They do not require any configuration and are available to application portfolio managers.
To access existing reports on an application portfolio:
1. Open the properties of the portfolio.
2. Click the drop-down list then Reporting.
You have access to the following reports:
• Cost report: presents the cost analysis of the portfolio applications.
• Business capability map breakdown: shows the distribution of applications in the business capabilities.
• Gantt Chart: presents the lifelines of the applications
• Business capability breakdown time report: shows the functional coverage changes of an application portfolio over time.
• List of applications: presents functional characteristics of portfolio applications as a matrix.
• Application positioning: shows the distribution of applications with respect to the business function addressed, functionalities covered and the technologies used. This presentation enables rapid identification of applications to be developed.
• Application TIME report: uses the Gartner TIME model to analyze the business value of applications. See also TIME Analysis.
• Software technology support alert: used to track the obsolescence of technologies.
• Business Capabilities Tree Map: breaks down a capability hierarchy according to the quantitative data of the applications in the portfolio (number of applications realizing the capability, cost of the applications).
SMART Analyses
HOPEX IT Portfolio Management offers two SMART analyses to evaluate the applications in a portfolio:
• TIME Analysis
• Cloud Migration Analysis
How the SMART analyses work
TIME Analysis and Cloud Migration Analysis are performed on a portfolio of applications. They present, for each application in the portfolio, the values of aggregated indicators, as well as the decision recommendation, when available.
Aggregate indicators are calculated from elementary indicators that have a default weight in the calculation.
The value of the aggregated indicators is accompanied by a data completeness percentage that evaluates the relevance of the analysis.
In the analysis report, commands allow you to:
• recalculate the values of the aggregated indicators
• graphically view the values of the aggregated indicators
• see the data completeness details: a matrix indicates which elementary indicators have been filled in for each application
• finalize the analysis
TIME Analysis
Based on aggregated technical and business indicators, this analysis presents rationalization recommendations for the applications in a given portfolio. The possible decisions are as follows:
• "Tolerate": applications that create sufficient business value and whose costs are manageable, maintained for various reasons.
• "Invest": applications that are most lucrative and interesting in terms of investment.
• “Migrate”: applications that need to be modernized.
• "Eliminate": applications that have low business value or high risk. They must be eliminated.
Cloud Migration Analysis
Presentation
Based on aggregated indicators, the Cloud Migration Analysis presents migration recommendations for applications in a given portfolio.
The aggregated indicators are:
• Migration Appetite
• Migration Easyness
• Migration Readiness
• Migration Safeness
Once the decision to migrate is made, it can be recorded for each application in the portfolio.
Indicator Calculation Rule
The analysis calculates a score between 0 and 4 for each elementary criterion. The value of the indicator is then aggregated with a weight assigned to it. The aggregate score is normalized to 100.
The value of the elementary indicators is based on:
• TIME matrix values:
• "Tolerate": means that the application has a good technical score but less at business level. It is kept pending a decision. Migration score: 2.
• “Invest”: high business and technical value. The application is already good as it is. Score: 3.
• "Mitigate": applies to applications that we want to keep but restructure. The migration score is high: 4.
• "Eliminate": applications to be excluded. Value: 0.
• The last criticality evaluation of the application (business, functional support, technology). See Evaluating Application Criticality.
• The migration motivations from the migration assessment questionnaire: the more options are checked, the higher the score. If 4 or more options are checked, the score is 4. See Evaluating the Cloud Migration.
• Application lifecycle: the more distant the end date, the more interesting it is to migrate to the Cloud. The value of the indicator takes into account the number of months between the start date and the end date of production:
• between 0 and 6 months = 0
• between 7 and 12 months = 1
• between 13 and 30 months = 2
• more than 49 months = 4
Recommandations and decisions
By default, the recommendations are calculated from the ranges of the Business Value and Technical Efficiency. indicators. The other indicators are not included in the recommendation.
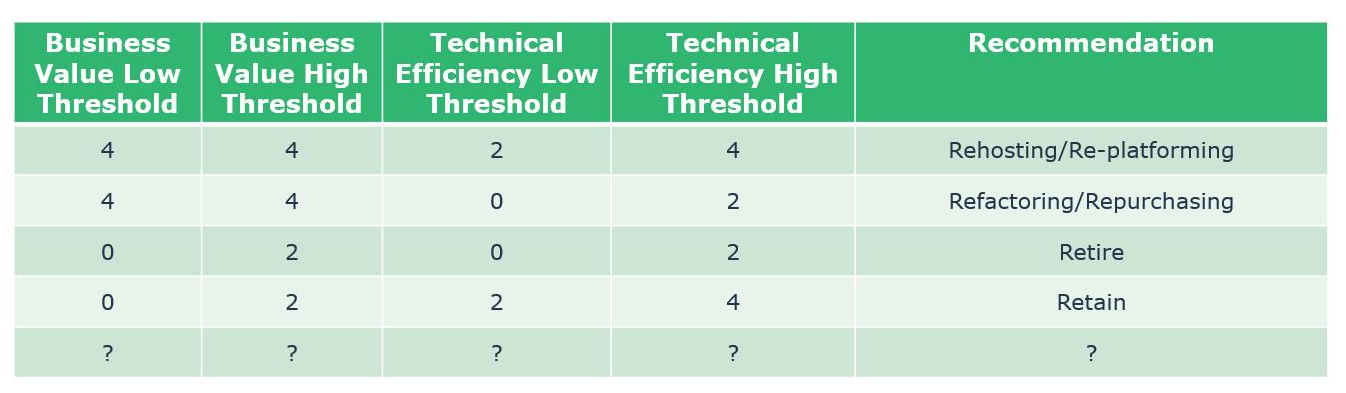
Recommandations of the analysis are:
• Rehosting/Re-platforming
• Refactoring/Repurchasing
• Retire
• Retain
On these recommendations, possible decisions are:
• Replatform
• Repurchase
• Retain
• Refactor
• Rehost
• Retire
Running a Cloud Migration Analysis
The Cloud Migration Analysis concerns a portfolio of applications.
To run the analysis:
1. Click the navigation menu, then Portfolios > Smart Analyses.
The list of portfolios appears in the edit area.
2. Check the box in front of the portfolio you want to analyze.
3. The Analysis button appears in the list of commands. Click this button.
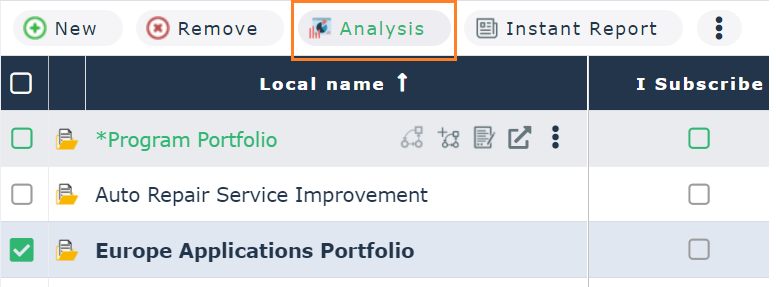
4. From the list of available analyses, select Cloud Migration Analysis.
The list of created analyses appears.
5. Click New to start a new analysis or on an existing analysis to view and/or update it.