Overview of functionalities
The functionalities presented here are standard functionalities for tabular entry mode. Many depend on the type of diagram described. Tabular entry mode can be configured for each type of diagram.
Title banner

At the top of the section, a banner contains:
• the name of the element described,
• vertical or horizontal display mode of component display in the diagram is available for BPMN diagrams only,
• the presentation mode of the table section with respect to the diagram section:
• presents the two section vertically ( ),
),
),• is used to return to the default presentation; the two sections are positioned horizontally ( ).
).
).• opens the diagram with the diagram editor ( )
)
)• displays or hides the section in which the diagram is found ( )
)
)• the Refresh diagram  button to refresh the diagram in non-synchronized display mode.
button to refresh the diagram in non-synchronized display mode.• the synchronization mode of the preview of the diagram that is used to optimize display performance.
Two preview modes are available:
• Synchronized mode: the preview is updated directly as the table is populated. Simply select the Synchronized mode check box.
• Non-synchronized mode: the preview is frozen, and can only be updated by clicking on a Refresh the diagram button.
Filter tabs
Tabs are used to display all the objects in the diagram broken down according to their type.
The number and the nature of tabs vary according to the type of diagram and the user profile.
For example, Processing Stream, Operations or Sequence Flow are the tabs proposed for an Organizational Process Diagram.
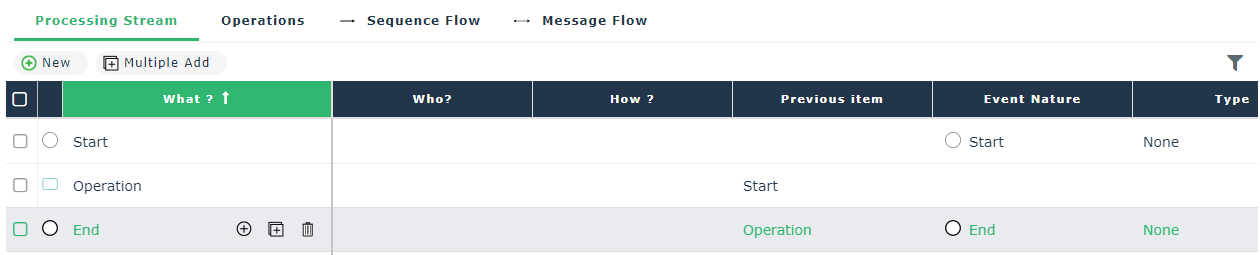
Tab content
Each tab presents, in table form, the list of objects of a given type contained in the diagram.
The characteristics and the links associated with each of them are presented in columns.
Use these tables to add objects to the diagram.
Multi-type tab
Depending on the type of diagram, it is possible to provide a tab that you can use to conduct actions on several types of objects contained in the diagram.
For example, in an organizational process diagram, use Processing Stream tab to position participants and define the sequences between the objects.
The content of the columns of the summary table is configurable.
Display of columns
You can display (or hide) some columns in the table, according to the tab you selected.
To do so:
1. Click the arrow v over any column header.
2. Select Columns
3. Tick the appropriate columns.