Handling a Bubble Graph
In a bubble graph, you can:
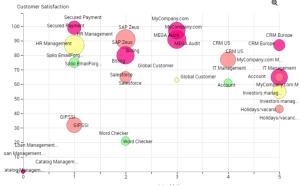
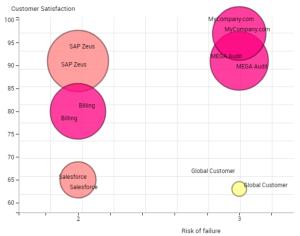
• display or hide the labels to lighten the graph
• display and highlight a bubble label
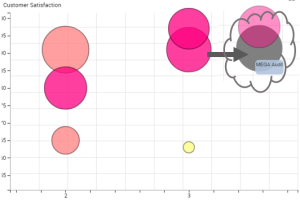
• display the link between each bubble and its label
• add a background image
• zoom in and move about in the graph
To improve a bubble chart:
1. Access the bubble graph.
2. (If needed) Zoom in and move about in the graph.
3. Modify the label style to display/hide the labels and their links.
4. (If needed) Add a background image.
5. Roll the mouse over a bubble to highlight its label.