Creating a Report Style
You can customize the style of a report. To apply this style customization to another report, you must create the style.
To create a style:
1. Open a report and customize its display.
2. Expand the Manage Styles section.
3. Click Save as style.
The report style creation dialog box opens.
4. In the Name field, enter the name of the report style.
5. Click OK.
Your report style is created.
Applying a Style to Your Report
To apply a style to your report:
1. Edit the report concerned.
2. Expand the Manage Styles section.
3. In the drop-down list of the Apply Style field, select the style that you want to apply to the report.
4. Click Apply.
The style is applied to your report.
Zoom in on a Diagram Part
For improved readability, you can zoom in on a part of certain charts (e.g.: bar charts, linear charts, bubble charts, dendrograms, radar charts).
Zooming in on a bar, linear, or radar chart

To zoom in on a part of a chart:
1. Access the report concerned.
2. In the chart, with the mouse, select the part on which you want to zoom.
The selected part is automatically zoomed.
 or double-click in the chart.
Zooming in and moving about in a dendrogram
To zoom in on a dendrogram:
1. Access the environment type report concerned.
2. In the dendrogram, use the mouse roller to zoom in/zoom out.
The zoom is performed on the dendrogram as a whole.
3. (if necessary) To move about within the chart, click the chart, keep the mouse button pressed and move the mouse.
Zooming in and moving about in a bubble chart
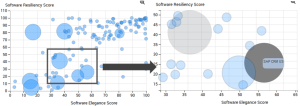
To zoom in and move about in a bubble chart:
1. Access the bubble graph.
2. In the bubble graph, use the mouse roller to zoom in/zoom out.
The zoom is performed on the graph as a whole.
3. (if necessary) To move about within the chart, click the chart, keep the mouse button pressed and move the mouse.
Zooming in and moving about in an environment graph
To zoom in and move about in an environment graph:
1. Access the environment graph report concerned.
2. In the graph, use the mouse roller to zoom in/zoom out.
The zoom is performed on the graph as a whole.
3. (if necessary) To move about within the chart, click the chart (outside an object), keep the mouse button pressed and move the mouse.
Handling an Environment Graph
For a better readability in an environment graph, you can:
• modify the object spacing
• modify the label length
• isolate an object
• zoom in on an object of the graph
• zoom in and move about in the graph
In the graph, you can also:
• perform searches to find objects in the graph
• access object properties
• access the object pop-up menu (right-clicking the object)
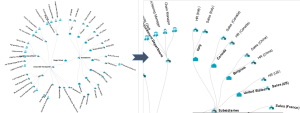
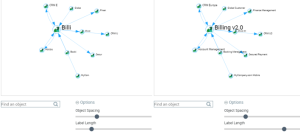
Improving an environment graph readability
To improve an environment graph readability:
1. Access the environment graph.
2. (If needed) Bellow the graph, click  to display the Options.
to display the Options.3. Move the cursors:
• Object Spacing, to the left to narrow the object spacing or to the right to increase the object spacing.
• Label Length, to the left to reduce or to the right to increase the character numbers of the labels.
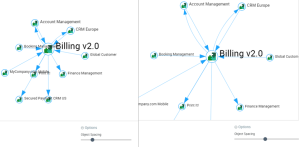
Isolating an object of an environment graph
To isolate an object of an environment graph.
1. Access the environment graph.
2. Double-click the object icon you want to isolate.
Only the objects in a direct environment of the object are displayed.
Example A: isolating HR Management
Example B: isolating Global Customer
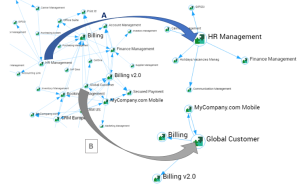
To come back to the whole graph, click the isolated object.
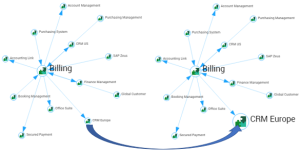
Zooming in on an object.
To zoom in on an object of an environment graph:
1. Access the environment graph.
2. Roll the mouse over the icon of the object concerned.
Only the object and its label are enlarged.
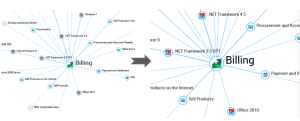
Finding objects in the graph
To find objects in the environment graph:
1. Access the environment graph.
2. In the Find an object field, enter the character string to be searched.
Example: manage
3. Click  .
.
.The objects that do not include the character string are grayed to highlight the wanted objects.
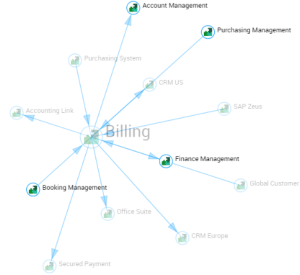
To come back to the standard display, delete the character string.
Displaying an object properties
To display an object properties in an environment graph:
1. Access the environment graph.
2. In the edit zone, click Properties  to display the Properties window.
to display the Properties window.3. In the graph, click the object concerned.
The object properties are displayed in the Properties window.
4. Click another object to display its properties.
This object properties are displayed in the Properties window.