Project Analysis Reports
Dynamic reports are provided by default for projects; they are used to analyze project content from different angles as well as their impact on the business capabilities and architecture building blocks.
Reports on the Project Content
Embedded reports on a project are visible in the Reports page of the project properties window.
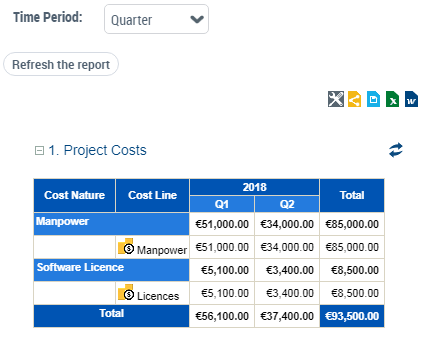
Project Costs
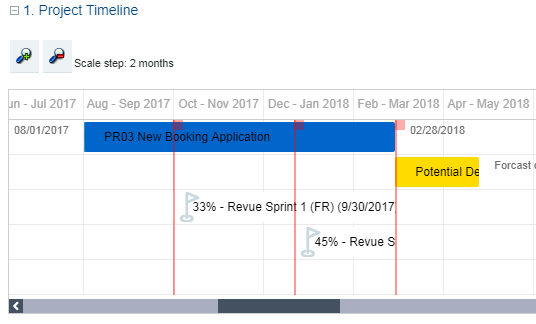
Project and Deliverable Timeline Gantt Chart
Project KPIs

Project summary
Impact Reports for Projects
The Project Portfolio Manager can use a report to analyze the impact of transformation projects on business capabilities.
This report aims to identify, for the business capability map of a given Enterprise phase, the relevant transformation projects and their impact on capabilities, according to the objective of the transformation projects.
To generate the impact report of transformation projects:
1. Click the Reports navigation menu.
2. In the edit area, click Create a report.
3. Search for report type "Projects Impact on Capability Map".
4. Create a report of this type.
Report parameters
The report takes as input:
• A capability map. The list of capability maps included in an enterprise phase is proposed by default.
• A project portfolio.
Filters allow you to customize the display of objects in the report:
• Enable Purpose Type Criterion: you can display or hide the purpose type of the projects. This option is enabled by default, with the form "Fill color": a color highlights the capabilities and projects in the report according to the type of purpose of the projects.
• Capability Filter: you can only display capabilities that are covered by solution building blocks. Criteria also allow you to represent the functionalities associated with capabilities in a specific shape (circle, triangle, etc.).
• Project Filter: you can display only on-going projects. Criteria also allow you to display the assessment levels defined on the projects (business value, cost, etc.).
Report Results
The report presents two chapters:
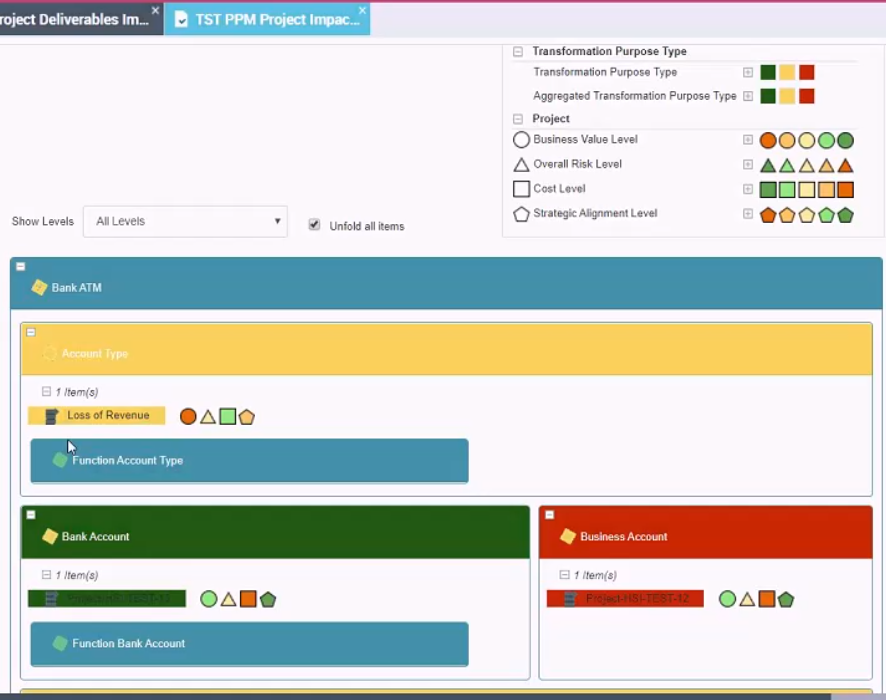
Transformation Projects Impact on Capability Map
By default, projects are displayed in the relevant capability boxes and highlighted in a color that depends on the type of transformation purpose.
• Innovate -> green
• Improve -> yellow
• Rationalize -> red
Capabilities are highlighted in a color depending on the associated transformation purposes.
• Majority of innovation -> green
• Majority of improvement -> yellow
• Majority of rationalization -> red
Enterprise Stage and Transformation Projects
This chapter displays in a table the projects that are not mapped in the capability map selected at report entry.
They correspond to the following elements:
• projects that produce new capabilities in the "target" capability map
• projects that do not achieve any capability
• projects that achieve capability but are not declared in the enterprise phase.