Managing Instant Reports
 
Introduction to Instant Reports
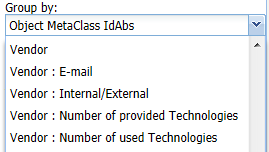
Grouping characteristics of concerned objects
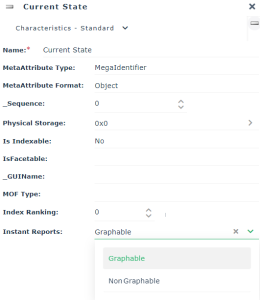
Attributes available in instant reports
Instant Report Types and Examples
Matrix (list)
Matrix (Report DataSet)
Quantitative (list)
Quantitative (Report DataSet)
Breakdown (list)
Breakdown (Report DataSet)
Table (Report DataSet)
Bubble chart (Multidimensional)
Heatmap
Word cloud
Time (Gantt)
Graph: Exchanges between applications
Dendrogram
Launching an Instant Report
Launching an instant report from a list
Launching an instant report from a Report DataSet
Creating a Dendrogram Instant Report (list)
Creating a Matrix Instant Report (List)
Managing a Table Instant Report data (Report DataSet)
Defining the columns in a table-type instant report
Adding a filter to the columns and to the column data values in a table-type instant report
Adding a filter to the columns and to the column data values (with initial values) in a table-type instant report
Example of column definition on a table
Example 1: column configuration with break
Example 2: column definition (display, order) and value computation
Example 3: filters on the table columns
Example 4: filter on the table columns and cells (initial values)
Saving an Instant Report
Saving the report
Saving an instant report as a report template
Handling an Instant Report
Adding a Dendrogram Instant Report to the Property Pages
Adding a dendrogram report to the Reporting page of an object
Adding a dendrogram report to the Overview page of an object
Adding an Instant Report to your Dashboard
You can generate instant reports that give access to a more detailed analysis of a list of objects.
Instant reports provide statistical graphic analysis of the data of analyzed objects. They provide an overview on trends, or easy comparison of objects according to certain characteristics.
Introduction to Instant Reports
When a list includes characteristics (attributes) enabling automatic report calculation, this functionality is proposed.
You can launch instant reports from:
a list of objects
a Report DataSet
You can:
choose the object characteristics to represent
E.g.: the cost of objects.
define the type of chart displaying the data
E.g.: quantitative, table, time.
(table type instant report from a Report DataSet), add filters to each input data item
customize your instant report
You can save an instant report:
in your reports
in your dashboard
The report is recorded as a Widget and available to other users.