Handling a Graph
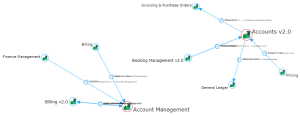
A graph illustrates relationships between objects. These relationships can be grouped to highlight the relationship density between certain objects.
The graph includes facilities to optimize its readability and customize its display.
You can:
• improve the graph readability:
• hide or reduce the length of labels
• hide isolated objects
• modify the object spacing
• focus on an object
• choose the analysis criteria (layers)
• ungroup grouped relationships
• highlight an object (style)
• modify the graph style
You can also:
• perform searches to find objects in the graph
• zoom in on and move about in the graph
• display the graph in 3D
• display the graph in full page
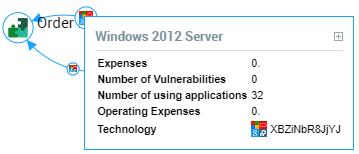
• display the properties available in tooltips
• access object properties
• access the object pop-up menu (right-clicking the object)
Modifying an object style in a graph
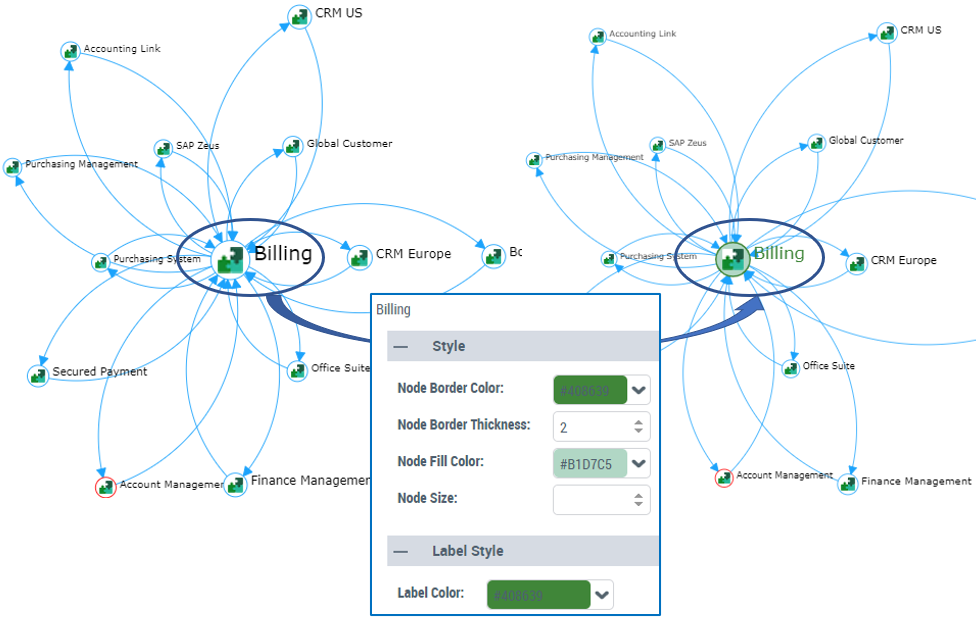
To highlight an object, you can modify for example:
• the border (color, thickness, style) of the object
• the fill color of the object
• the label color of the object
• the size of the object
To modify the size of an object:
1. Edit the report (click
More  > Edit Report
).
2. In the report page, click
Edit Style Parameter Values 
and select an object.
The edit pane of the object appears to the right.
3. In the Style section, modify the object style.
4. In the Labels Style section, modify the label color.
Modifying a graph style
You may, for example:
• define fixed size nodes

By default the node size is proportional to its connections.
• not color entry points
By default entry points are highlighted with another color (e.g.: red).
• define a background color to the graph
By default the graph background is white.
• modify the arc curvature
By default:
• single arc: straight arc
• two arcs: curved arcs
• more arcs: curved arcs, with the first arc straight
You can define:
• all arcs curved
• all arcs straight
Be careful with this setting as arcs overlaps.
Improving a graph readability
To improve a graph readability:
1. (If needed) Zoom in and move through the graph.
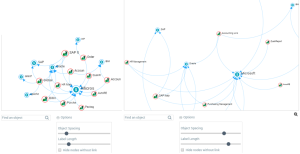
2. Below the graph, select
Options 
and move the cursors:
• Label Length, to the left to reduce or to the right to increase the character numbers of the labels.
• Object Spacing, to the left to narrow the object spacing or to the right to increase the object spacing.
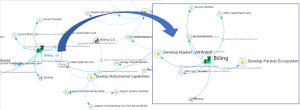
3. To isolate an object (display it with its direct relationships), hover the mouse over the object, and in the tooltip, next to its name, click
Focus 
.
The selected object is isolated.
Click in the graph to display the full graph again.
4. To hide the isolated objects (nodes), below the graph, select
Options and
Hide nodes without link.
Displaying a graph analysis criterion
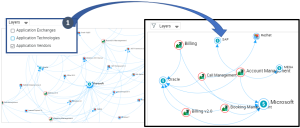
When a graph contains several analysis criteria, you can restrict its display to a single active layer.
That way, you can quickly switch from an analysis criterion to another one or overlay them.
To choose the analysis criteria to be displayed:

Above the graph, click
Layers and select the analysis criteria that you want to display.
The cleared analysis criteria are hidden.
Beside
Layers,

indicates that analysis criteria are filtered.
Finding an object in the graph
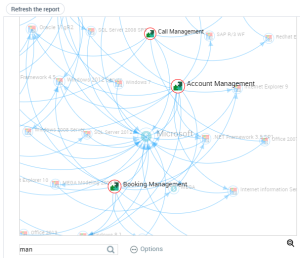
To find an object in the graph.
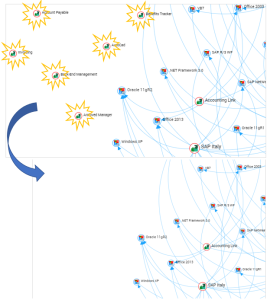
1. Below the graph, in the Find an Object field, enter a character string.
E.g.: enter "man".
The objects that do not contain the character string entered are automatically grayed.
2. To display all the objects again, click Refresh the report.
Zooming in and moving through a graph
To zoom in and move through a graph:
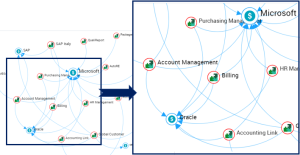
1. In the graph, use the mouse wheel to zoom in/zoom out.
The zoom is performed on the graph as a whole.
2. (if necessary) To move about within the chart, click the chart (outside an object), keep the mouse button pressed and move the mouse.
Displaying a graph in 3D
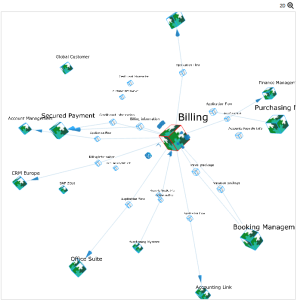
To display a graph in 3D:
1. Above the graph, click 3D.
The 2D button replaces the 3D button.
The graph is displayed in 3D.
To return to 2D, click
2D.
2. If needed:
• Click in the graph and move the mouse in order to make the graph as readable as possible.
• Focus on another object to highlight another object.
Handling a relationships grouping
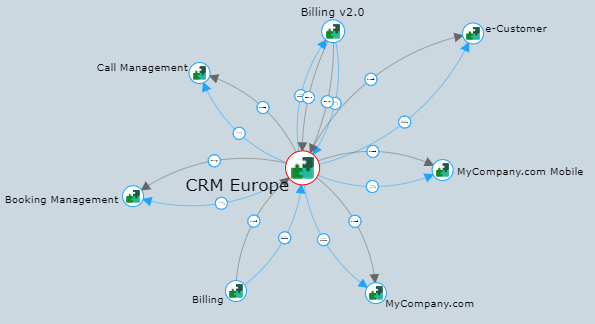
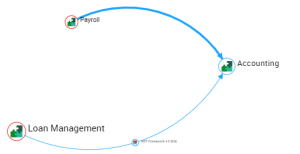
In a graph, relationships between two objects can be grouped. A relationship grouping is identified by its stroke thickness. The strokes standing for relationships are called arcs.
E.g.: the arc between "Payroll" and "Accounting" stands for a relationship grouping.
You can:
• display the number of arcs included in the grouping
• ungroup arcs to display their intermediate objects
• simply display the list of intermediate objects
To handle an arc grouping:
1. (If needed) In the graph, find and/or isolate an object for more readability.
2. Move the cursor over the data Data.
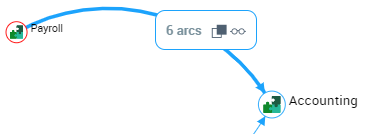
A tooltip displays the number of arcs included in the grouping.
Example: the arc grouping between "Payroll" and "Accounting" stands for six arcs.
3. You can:
• display the arcs of the grouping and their objects: click
Ungroup arcs 
.
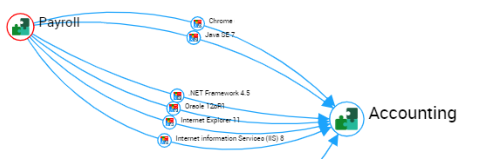
To regroup the arcs, hover the mouse over one of the arcs and click
Group arcs 
.
E.g.: each arc between "Payroll" and "Accounting” includes one intermediate object (the grouping includes six intermediate objects).
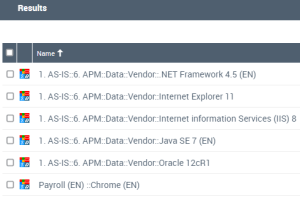
• simply list the intermediate objects in the
Results window: click
Click to view details 
.
Displaying the graph in full page
You can display the graph in full page. With this display, you keep the filtering, the object search, and the options, but you cannot edit the report.
To display the graph in full page: at the top right corner of the graph, click
Display in full page mode 
.
To exit the full page mode, click
Exit full page mode 
.
Displaying the properties available in tooltips
Tooltips enable to display the properties available on:
• an object
• a relationship
• an intermediate object (object included in a relationship)
To display the properties available in tooltips in a graph:
1. Access the graph, and if needed find and/or isolate an object for more readability.
2. Hover the mouse over:
• the object concerned to display its available properties.
• the relationship concerned to display its available properties.
• the intermediate object concerned to display its available properties.
A maximum of five properties are displayed, click
Display more 
to display more (if any).
Example: Application Environment Graph
The application environment graph report is available on an application. It includes several graphs showing the selected application in different environments.
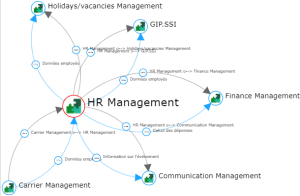
E.g.: Flows and Data Graph of the application.
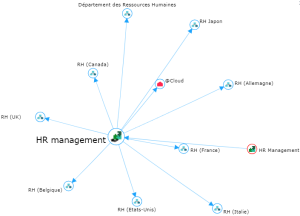
E.g.: Software Installations Graph of the application.
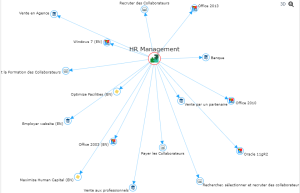
E.g.: Functional Environment Scope Graph of the application.