Customizing a Pie Chart Display
You can customize the display of a pie chart of your report at the following levels:
• chart content
• Label format
• Label hiding threshold
• Chart title
• chart style
• Chart width
• Font (style, color, size)
• Donut format
• series style
• Export style

The values modified locally override the global values defined for all reports.
You can reset the default values at:
• a parameter level
• an entire chapter level
You can also:
• hide a data series
• modify the legend
• position
• format
• add descriptions
• report level
• report chapter level
• get the list of objects contained in a series
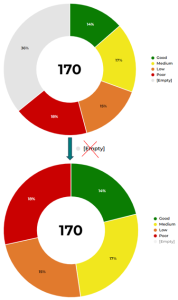
Hiding a data series
For improved readability, you can hide data series in the report chart.
To show/hide a data series:
1. Edit the report (click
More  > Edit Report
).
2. In the report legend, click the data series concerned.
In the legend, the color that represents the series is grayed.
The series is not shown anymore in the chart.

You can hide several series.
Example: in the chart showing the breakdown of applications according to their current state, you can hide the series "[empty]" that represents the applications whose state is not entered.
3. In the legend, click the series again to re-display it in the chart.
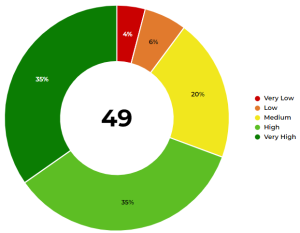
Modifying the legend position
By default, the pie chart legend is positioned to the right of the chart.
You can hide the legend or change its position:
• below the chart
• in the chart
To modify the legend position:
1. Edit the report (click
More > Edit Report ).
2. In the report page, click
Edit Style Parameter Values 
and select
All Series.
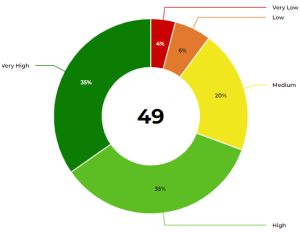
3. In the Legend Style section, modify the Legend position value.
Example: Labels with lines.
4. Click Apply.
Your modifications are immediately taken into account in the report.
If the modifications do not automatically appear, click

.
Modifying the legend format
By default, the pie chart legend is positioned to the right of the chart.
You can also display their values, percentages, or mix them.
To modify the legend format:
1. Edit the report (click
More > Edit Report ).

To directly access the legend format parameters, in the report toolbar, click
Edit parameters  > Presentation
.
2. In the report page, click
Edit Style Parameter Values 
and select
All Series.
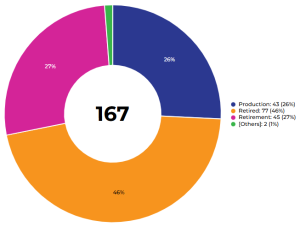
3. In the Legend Style section, modify the Legend format value.
Example: Label, value, and percentage.