Consulting a Supervision Event File
To consult an event of a supervision file:
1. From your workstation system tray, right-click HOPEX Server Supervisor  and select Supervision.
and select Supervision.The current supervision file opens.
Alternatively, from Supervision chart toolbar, click Open Supervision data file  and select the files.
and select the files. 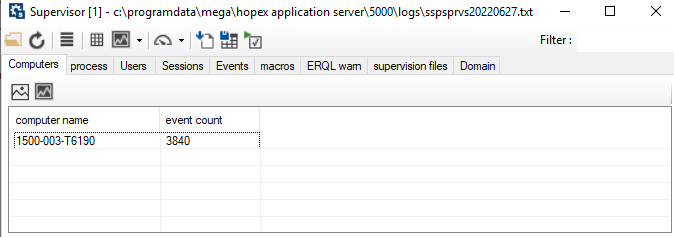
2. (optional) If you are on the current supervision file, click Refresh  anytime you want to immediately refresh the view data.
anytime you want to immediately refresh the view data.3. Click the tab regarding the view you want to consult:
4. Double-click the line of the view you want to consult the events.
Events regarding this view are displayed in table format.
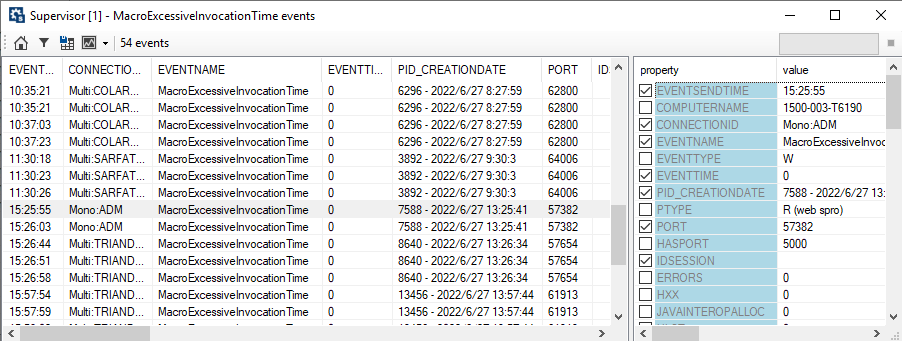
Each line represents an event of which characteristics are detailed.
5. (optional) In the property pane, select the indicators (columns) you want to be displayed in a table column.
6. (optional) Right-click the event for which you want to display a graph and select show graph for <event name>.
The graph is displayed.
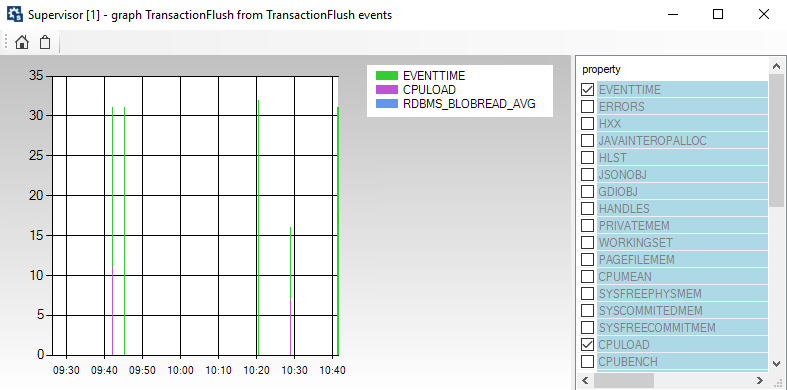
7. In the property pane, select the indicators you want to be displayed in the graph.
The graph is calculated on the set of the prefiltered original view, taking into account the event selected.
8. (optional) Click copy graph image to clipboard  to copy the graph image in the clipboard.
to copy the graph image in the clipboard.