Reports on Business Capabilities
Breakdown Report of Business Capabilities
You can use this report to display the realization coverage of business capability elements by operational elements such as logical and physical applications, application systems, etc.
Report example
The example below enables viewing of the coverage rate of the business capability map specified as parameters by processes.
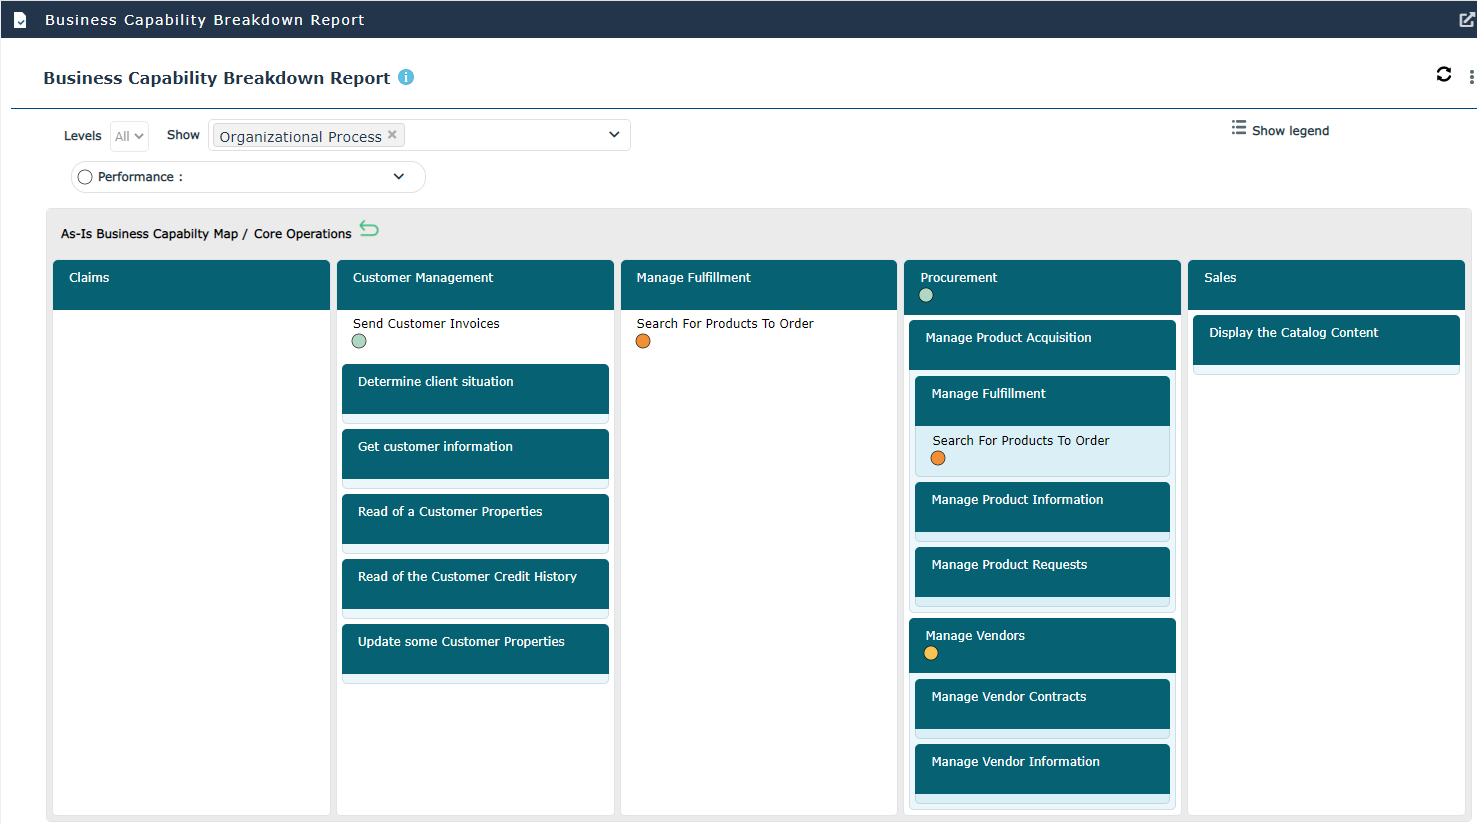
Example of a business capability map breakdown report
Business Capability Map Report
A Treemap shows a hierarchy of data as nested boxes whose size varies according to the associated value.
This report breaks down a capability hierarchy into a treemap according to three available criteria (parameters):
• Number of components: the surface area is proportional to the number of descendants in the tree.
• Application ratio: the surface area is proportional to the number of realizing applications of current and descendant capabilities in the tree.
• Cost of applications: the surface area is proportional to the cost of applications realizing current and descendant capabilities in the tree.