Repository Performance and Health Tests
With HOPEX you can generate a daily repository health report. This report enables to detect:
• performance or usage anomalies that users can face daily.
• any significant change.
For this purpose, performance and health tests are run daily. Events are generated when anomalies are detected
Test Description
Infrastructure performance test description
HOPEX standard use scenarios are carried out every afternoon ("RepositoryHeath Daily Afternoon Trigger” job, 04:00 pm GMT):
• Reading of 1000 existing large objects (BLOB).
• Exploring an existing graph (1000 objects and 500 MetaAssociations).
• ERQL query on an existing graph (1000 objects and 500 MetaAssociations).
• Reading of 1000 large texts (BLOB).
• Creation of a graph including 1000 objects and 500 MetaAssociations.
• Deletion of a graph including 1000 objects and 500 MetaAssociations.
• ERQL query on a recently created graph (1000 objects and 500 MetaAssociations).
Each scenario generates a result, which is stored in the repository. These results are analyzed daily in the evening ("RepositoryHeath Daily Evening Post Trigger” job, 11:05 pm GMT)
An history of 30 results are needed before generating an alert.
Repository health test description
It is essential to analyze certain usages to identify anything that might compromise data integrity, whether in the daily work or following a HOPEX update.
For all of the repositories of all of the environments, the following checks are performed every evening ("RepositoryHeath Daily Evening Trigger” job, 11:00 pm):
• Administration
• Compatibility checks between the SQL structure of the data and the server version.
• table fragmentation
• index fragmentation
• SQL maintenance plan execution
• Customization
• HOPEX data modification
• HOPEX data volume
• Usage
• workspace volume
Viewing the HOPEX Health Reports
Accessing HOPEX daily health reports
The Administration desktop gives access to HOPEX daily health reports. Each report includes the anomalies detected on all the machines, in all the repositories.
Reports are listed chronologically (the oldest first) in the following format:
HopexHealthFullReportYYYY-MM-DD_hh-mm-ss.html
with: YYYY: year, MM: month, DD: day, hh: hours, mm: minutes, and ss : seconds.
To view HOPEX daily health reports:
1. Connect to the Administration desktop.
2. Click the Repository navigation menu and select Repository Health Reports.
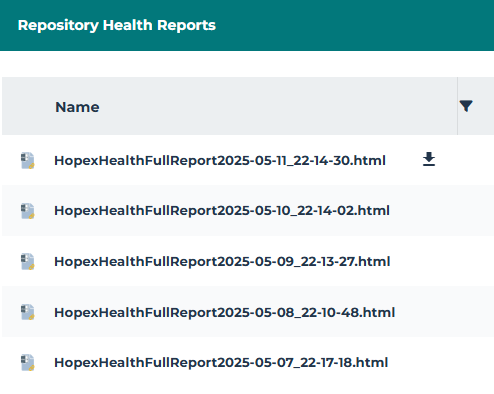
3. In the report list, hover the cursor over the report of interest and click Download report  .
.
.The report is available in your downloads.
4. Click (+)/(-) beside the name of the machine, environment, repository, or aler to display/hide its details.
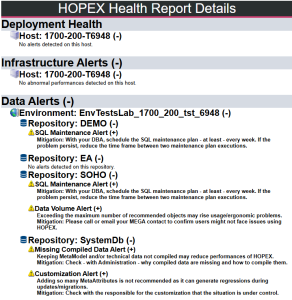
HOPEX Health report description
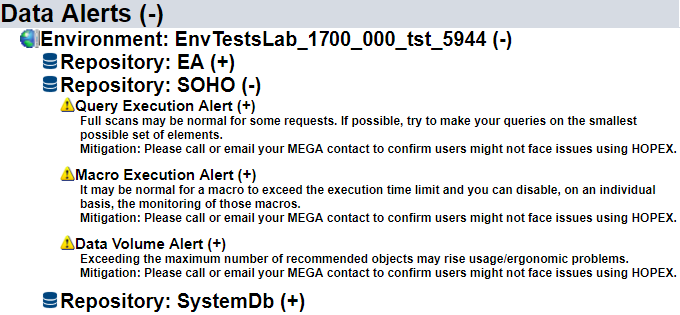
The HOPEX health report includes a short description of the anomalies detected at performance or usage level. It shows alerts detected at:
• infrastructure level (Infrastructure Alerts)
• data level (Data Alerts) for each repository of each environment
Example : detection of three alerts ("Query Execution Alert", "Macro Execution Alert" and "Data Volume Alert") at data level, on "Soho” repository.