Report Data View Properties: Graph
A Report Graph View is used to display a graph in a Report Container. The data displayed in the graph is provided by a Report Data Source of GraphSet Definition type.
Characteristics
The Characteristics page includes the following properties:
• Sharing:
• "Public" (default): the Report Graph View can be reused in several reports. The Report Graph view is available at Report Template or Report Chapter creation.
• "Private": the Report Graph View cannot be reused.
• Data Source shows the GraphSet Definition on which the Report Graph View is based.
• General Style defines the style to apply to the Graph view (i.e. values for a set of renderer type parameters)
For example: node display style.
• 3D illustration defines whether 3D display is available or not
• Default illustration defines the default display when 3D illustration is available
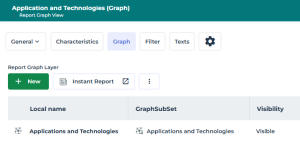
Graph
The Graph page enables to modify each Report Graph Layer display:
• its Visibility
Values: Visible, Never visible, or Hidden by default.
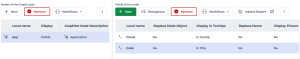
• its data display:
• the Visibility of its Nodes, and for each node the display of its fields
A field can replace the node object, be displayed in tooltips (by default), or replace the object name.
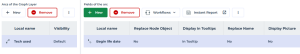
• the Visibility of its Arcs, and for each arc the display of its fields
Filter
The Filter page enables to define which filters can be displayed in a report for this Report Graph View.
A filter enables to restrict the nodes or fields that are considered in the report.
A filter is defined by the following Characteristics:
• Filtering Group Id
• Input type defines how the report user can define its condition:
• "Single Value"
• "Multiple Values"
• "Continuous" to define a range of values.
• Behavior defines the filter action on the report:
• "Immediate Refresh" (for a report easily calculated): as soon as the user modifies the filter the report is updated.
• "No Refresh": the user needs to click the Refresh button to update the report.
• values:
• Contains: defines the values the user can use for a specific filter.
• Shows: defines how to manage empty values.
I.e.: "Add empty values", "Display only empty values", "Display only non empty values", or "Consider all values"
• for numerical values: Less than, Equals to, Greater than
• for character strings: Begins with, Ends with
Report Graph Node properties
A node is defined by the following Characteristics:
• Name Display attribute enables to hide the name of node in the Graph.
Values: Show Name (default) or Hide Name.
• Display attribute enables to hide the node in the Graph.
Values: Visible (default) or Not visible.
You can also define a Style (or conditional style) on a node, see Style.
Report Graph Arc properties
An arc is defined by the following Characteristics:
• Visibility attribute enables to override the visibility of the GraphSet Arc Definition in the Graph.
Values: Visible (default) or Not visible.
• Arc Direction attribute enables to override the orientation of the GraphSet Arc Definition or to hide the arrow in the Graph.
Values: Default, Reverse, or No arrow.
• Grouping specifications section enables to configure:
• a grouping by object or by field, or grouping all of the arcs
• the detailed list of objects
Values: Node, Object field of a node.
You can also define a Style (or conditional style) on an arc, see Style.
Style
The Style page enables to define values for a set of renderer type parameters of the Report Graph View at graph element level (node, arc).
The Style page of a node/arc enables to define a style on the node/arc when the condition is satisfied.
If no condition is set, the style always applies. You can create a set of conditions and associate each of them with styles. Conditions are considered one after another.
The style can apply:
• to all the nodes or arcs,
• on condition to certain nodes or arcs
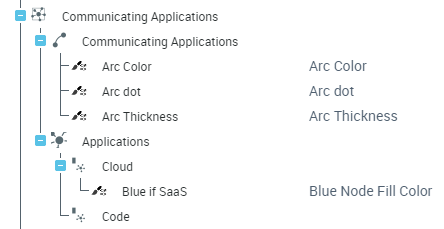
For example, you can define:
- a specific style on arcs.
- a conditional style on nodes: the nodes "Applications" for which the "Cloud" field value is "Saas" are displayed with a blue background.