Dashboard for Portfolio Projects
This report analyzes the projects included in a portfolio using different graphics.
To launch this report:
1. Display the properties concerned.
2. In the properties window, click the drop-down list and select the Reports page.
3. Select the "Project Dashboard" report.
Project bubble chart
The bubble chart is used to connect the different key indicators of the portfolio projects.
To define the project indicators to be displayed in the graph:
1. In the X-axis field, select the first indicator, for example, the profit.
2. In the Y-axis field, select the second indicator, for example, the total cost.
3. In the Bubble size field, select the third indicator, for example, the ROI.
4. Click Refresh the Report to take the selected data into account.
Project matrix by criteria
For this graph, the parameters selected for report input must be of "enumeration" type (e.g. Risk level, Business Value Level).
It allows to consult evaluations of a larger number of projects than the bubble graph (several hundred projects vs. a few dozen).
When you modify the input parameters, you must click on Refresh the Report to take into account the input data, then click the refresh button of the  chapter to update it.
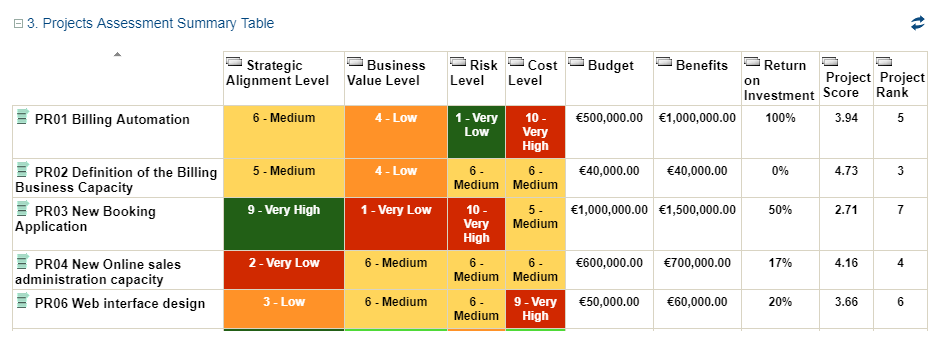
chapter to update it.Summary table for project assessments
This table presents the latest assessment of the key indicators of the portfolio project.
See also Assessing a Project.