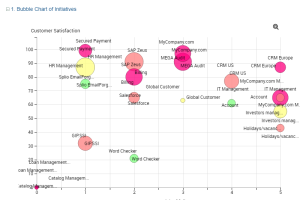
Handling a Bubble Chart
In a bubble chart, you can:
• modify the bubble and label style:
• display, hide or reduce the length of labels to lighten the chart
• display and highlight a bubble label
• display the link between each bubble and its label
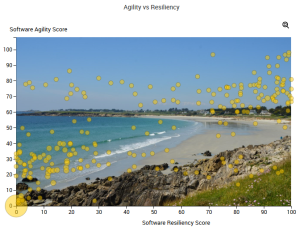
• add a background image
• handle the chart:
• display the legend
• zoom in on and move about in the chart
• get the list of objects contained in a bubble
Modifying the style in a bubble chart
You can, for example:
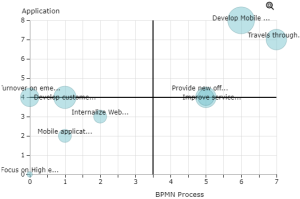
• display median axes
• modify the bubble color
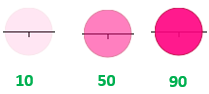
• modify the bubble opacity
By default: 50; to increase the opacity, set a value higher than 50; to decrease the opacity, set a value lower than 50.
• modify the bubble text font
• add a background image (.png format)
You can add an image (.png format) that is stored in HOPEX (in Mega_Std folder of HAS Customization)
To modify the bubble style in a bubble chart:
1. Edit the report (click More  > Edit Report
  ).
).
> Edit Report ).2. In the report page, click Edit Style Parameter Values  and select All Series.
and select All Series.The edit pane appears to the right.
3. In the Style section, modify the relevant parameters.
 . Caution: all parameter values in the report are also reset.
4. Click Apply.
Your modifications are immediately taken into account in the report.
 .
.Improving a bubble chart readability
To improve a bubble chart readability, you can:
• zoom in on and move about in the chart.
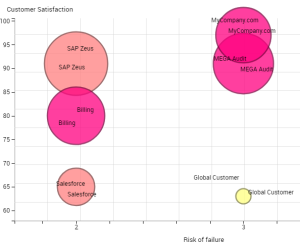
• modify the label style to display/hide the labels (by default) and their links.
• Display/hide the labels: in the chart menu bar, click Options then select/clear Display Labels.
You can also move the Label Length cursor to reduce the length of the labels text.
• add a background image
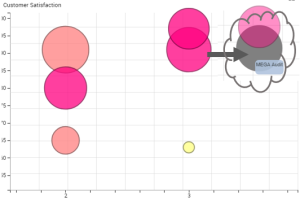
5. display its label: hover the cursor over the bubble
Zooming in and moving through a bubble chart
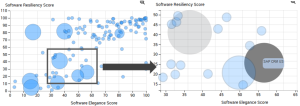
To zoom in and move through a bubble chart:
1. In the bubble chart, use the mouse wheel to zoom in/zoom out.
The zoom is performed on the chart as a whole.
2. (if necessary) To move through the chart, click the chart, keep the mouse button pressed and move the mouse.
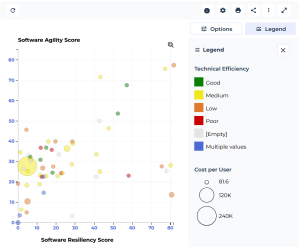
Displaying the bubble legend
If applicable, you can display the legend of:
• bubble colors
• bubble size
To display a bubble chart legend:
 .
.E.g.: here the bubble color represents the “Technical efficiency” characteristics and the bubble size represents the “Cost per user” characteristics.