Process Map Treemap
This report represents the weight of components, applications or risks per processes, within a process map.
The report is presented as a Treemap.
Path
Property pages of a Process > Reporting > Process Map Treemap.
Report filters
|
Filter
|
Function
|
|---|---|
|
Number of displayed levels
|
This filter enables to define the level of granularity for process breakdown (from a process category to an operation oar any finest level of detail).
|
|
Display criterion
|
This filter enables to select the type of element to display among number of risks, number of applications or number of components.
|
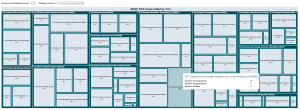
Result
The report displays the breakdown of a process map into process categories and sub-categories, with a certain level of detail according to the selected number of displayed levels.
Each process category or sub-category has a surface that is proportional to the number of elements, according to the selected Display criterion (e.g. Number of applications used in a process category).