Defining Application Life
To enable detailed analysis of repository object evolution scenarios and the associated costs, HOPEX IT Portfolio Management enables description, from an object life, of the planning of steps in the object life cycle.
Viewing Application Life (Gantt Chart)
An object evolving over time can take different states (preparation, production, retirement, etc.).
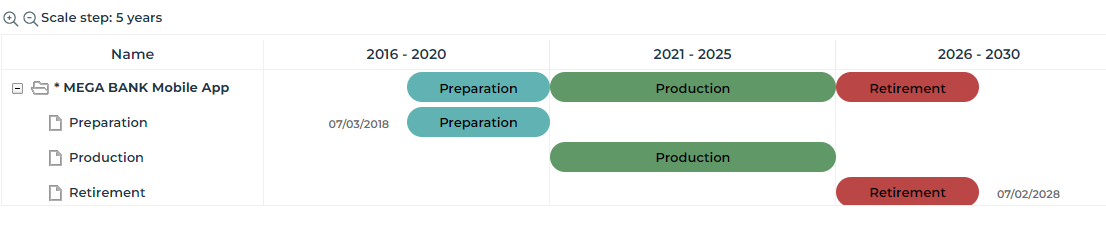
The Object life enables viewing of the planning of these different states in the form of a Gantt chart.
To view the Gantt chart representing the different states of an application for example:
1. Open the application properties.
2. Click Characteristics.
3. Expand the Gantt section.
The first line shows the synthesis of the life cycle of the application, with the sequence of different states. Under this line you access the details of the time periods associated with each state (preparation, production, etc.).
Initializing the life of the application
The object life is a set of time periods representing the updated calendar of object life cycle states.
To create the life of an application:
1. In the Gantt section, click Initialize the Life of the Object.
The creation of object life dialog box appears.
2. Specify the following characteristics:
• a Life Cycle which enables definition of the list of possible states of the object.
• a Begin Date and an End Date which enable positioning of the object life in time.
3. Click OK.
The object life appears in the Gantt chart of the application.
From information on object life, the Gantt chart represents planning of the different steps in time.
Updating the dates of an application life
By default, the different steps in the object life cycle are distributed in equal time periods between object life begin and end dates.
These dates are accessible and can be modified in the application Gantt chart.
Accessing properties of a time period
In the Gantt chart, the pop-up menu of a time period presents commands specific to the described application ("Billing" in our example), followed by the commands relating to the time period itself.
To access properties of a time period of the application life:
1. In the Gantt chart, right-click the time period.
2. In the time period pop-up menu, select Properties.
See also: Defining Life Cycles.
Gantt Chart Report
On an application, a report in the form of a Gantt chart enables viewing of steps in the application life cycle, its deployment and the technologies used. See Analyzing Application Life Cycle and Installations.
Application decommissioning plan report
As an enterprise architect, you can analyze application end-of-life planning to ensure that functional coverage is not compromised, and identify potential action plans.
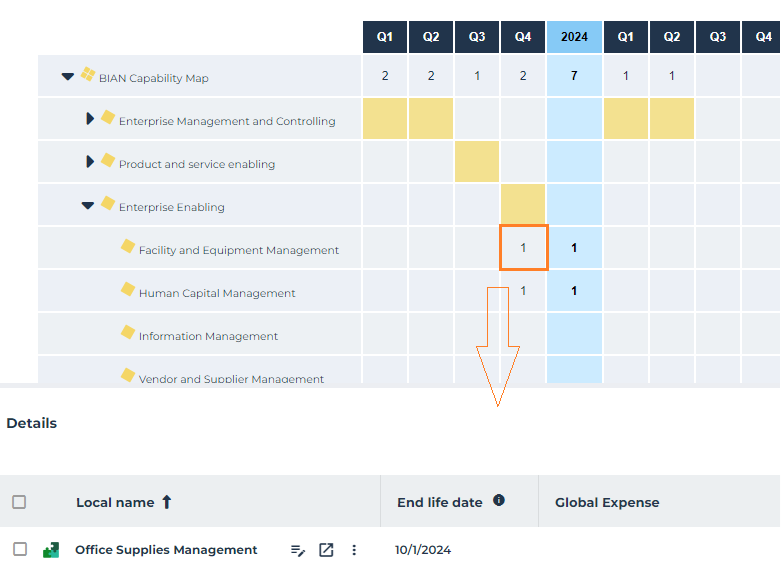
The Decommissioning Plan report covers a map of business capabilities and associated applications. For each capability, it shows the number of applications scheduled for retirement over the next few years, quarter by quarter.
You can filter applications by portfolio.
To create an application decommissioning plan report:
1. Click the Reports menu.
2. At top right of the edit window, click Create a report.
3. Search for and select the report.
4. Click Create a report.
5. In the report creation wizard, select:
• a business capability map
• (optional) an application portfolio
6. Click Preview.
7. Click Continue.
8. You can specify the following elements:
• report name
• public concerned
• tags
• description
9. Click Save and open.
The report opens in the edit area.
For the defined capability map, the report shows the number of applications that will be removed.
To display application details:
Application details appear at the bottom of the report.