Reports Embedded in a Portfolio
The different report templates proposed as standard by HOPEX IT Portfolio Management are designed to compare initiatives of a portfolio based on specific criteria. Different report types offer different analysis possibilities.
These reports are based on information provided by the application owners. They do not require any configuration and are available to application portfolio managers.
To access existing reports on an application portfolio:
1. Open the properties of the portfolio.
2. Click the drop-down list then Reporting.
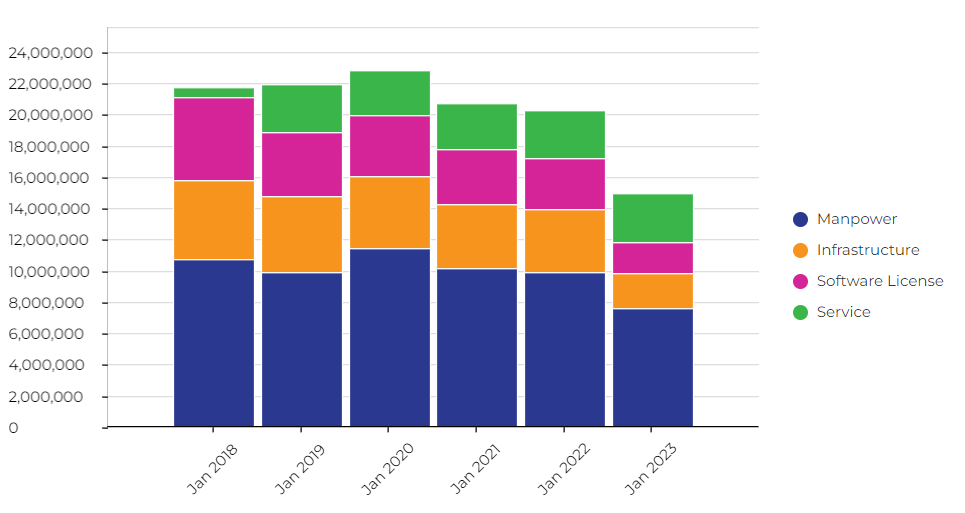
Costs Report
The report presents the cost analysis of the portfolio applications, by type (manpower, infrastructure, etc.) and by year. It offers different views:
• A graphical view of the cost breakdown
• A table of costs by nature
• A table of costs by application
Example of costs (graphical view)
Gantt Chart
The Gantt chart represents the lifelines of applications making up the portfolio.
The preparation, production and retirement phases are described for each application.
Example
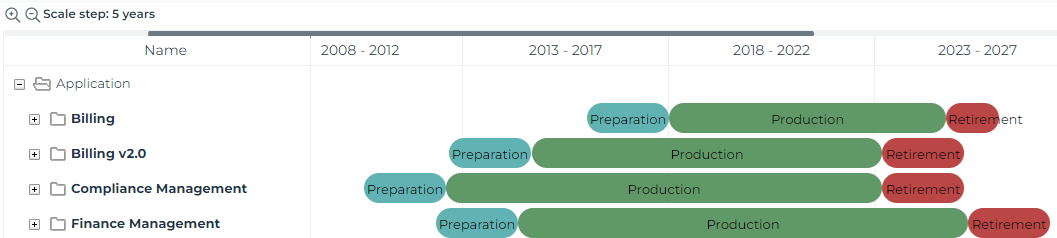
You can customize the report scale to 1, 2 or 5 years.
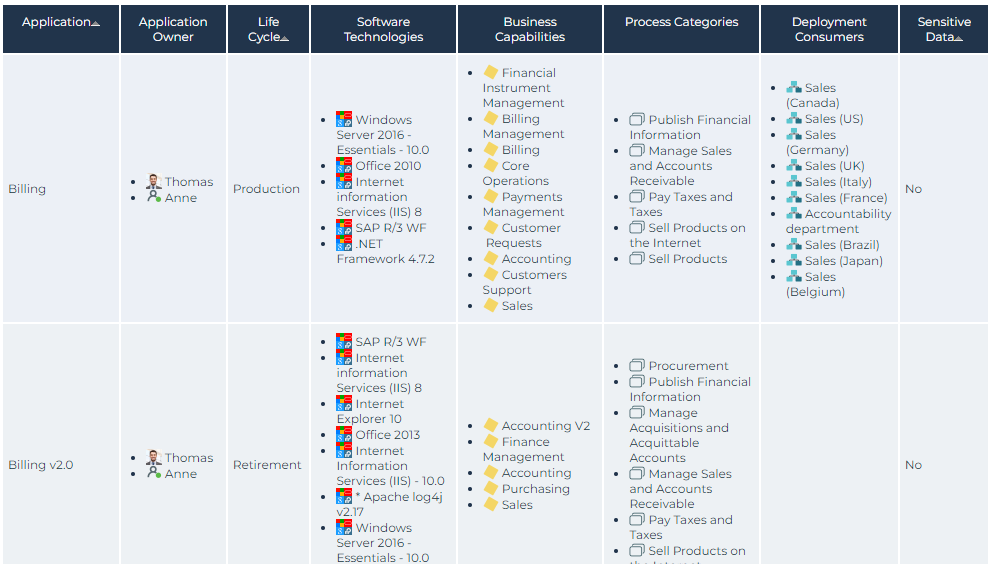
Application Inventory and Dependencies
This report presents the functional characteristics of the portfolio's applications in matrix form (lifecycle, associated technologies, business capabilities covered, etc.).
Example
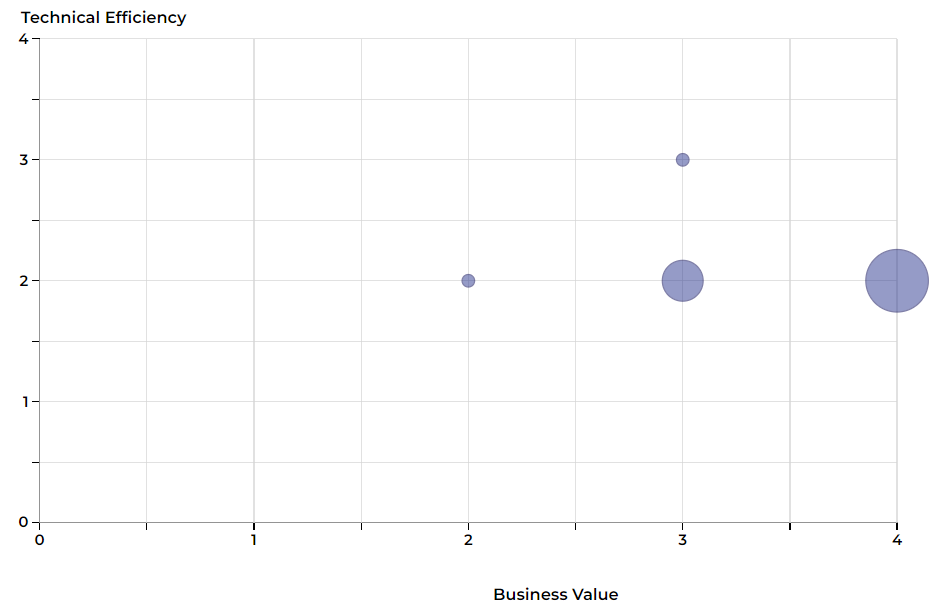
Application Positioning
This report shows distribution of applications related to the business addressed, functionalities covered and technologies used. This presentation enables rapid identification of applications to be developed.
The report is based on the Business Value, Functional Support and Technical efficiency from the latest application evaluation.
Example
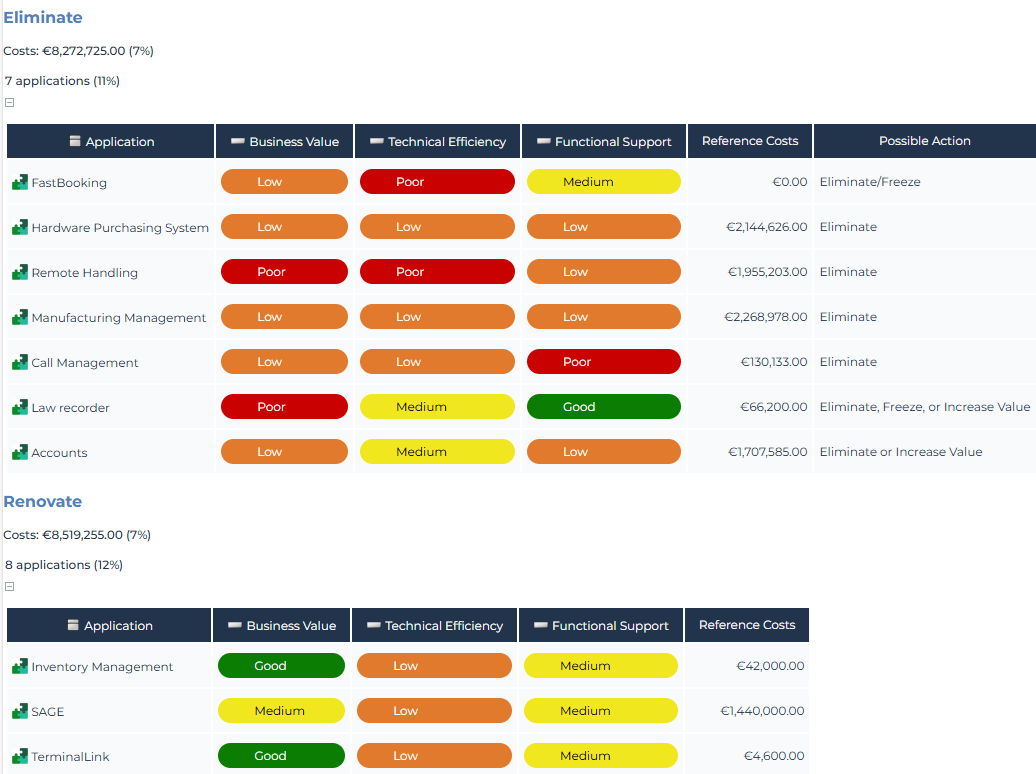
Applications TIME Report
This report uses Gartner's TIME (Tolerate, Invest, Migrate and Eliminate) model to analyze the business value of applications.
In the Assessed characteristics, you can select functional support or technical efficiency.
Example
Business Capability Maps
This report covers distribution of applications in business capabilities .
Software technology support alert
This report tracks the obsolescence of technologies associated with the application portfolio.
It uses the technology Support Alert attribute to detect any conflicts between their use in the organization and their official lifecycle.
Example
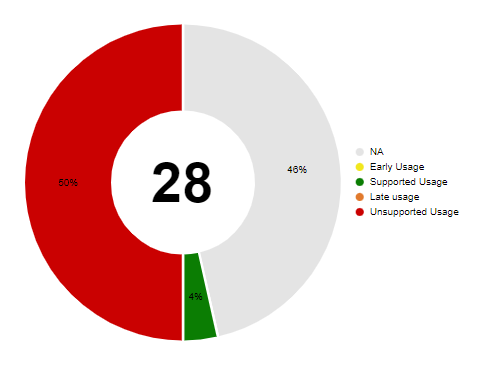
Click on a percentage of the graph to access the list of technologies concerned.
Data handled by portfolio applications
This report presents the data used by the portfolio's applications in the form of a word cloud.
Data Category of Portfolio Dendrogram
This report displays in dendrogram form the data used by the applications in the portfolio, according to their category.
Other Reports
Other reports, available in the list of report templates supplied as standard, offer an analysis of portfolio content.
See: