Report Template Creation: The Big Picture
Displaying a Table, a Radar/Line/Bar/Pie Chart, a Set of Gauges, or a Word Cloud
You can create a Report Template showing a table, a radar chart, a line chart, a bar chart, a pie chart, a set of gauges or a word cloud:
• from a Report DataSet, or
• using a Report Table View
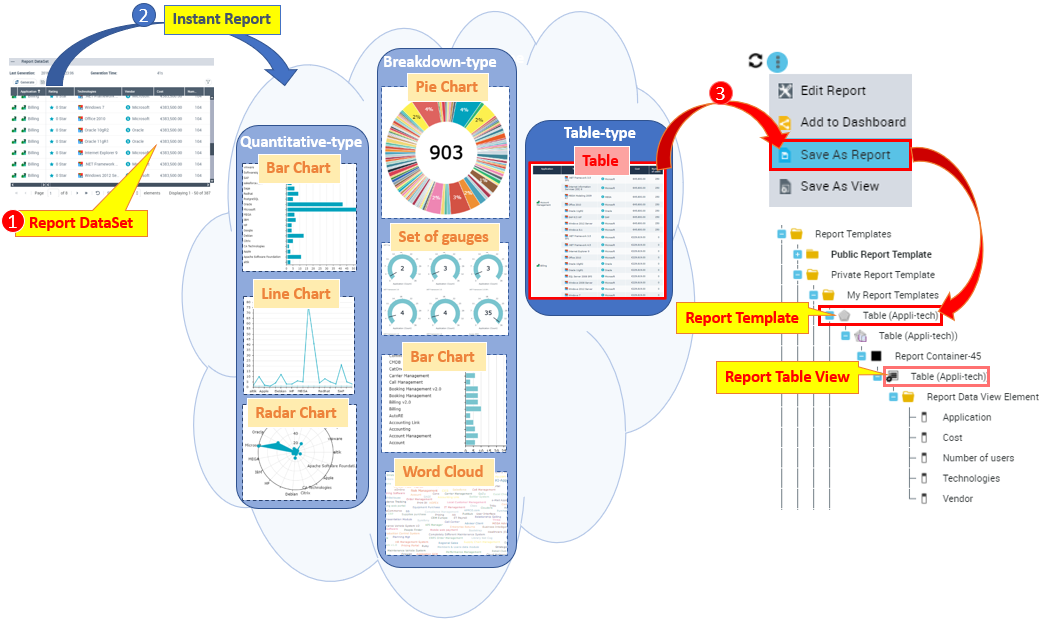
From a Report DataSet
To create a Report Template showing a table, a radar chart, a line chart, a bar chart, a pie chart, or a word cloud:
1. Access a Report DataSet.
2. From the Report DataSet, generate the Instant Report type corresponding to the chart type you want to display in the report:
• Breakdown for a pie chart, a bar chart, a set of gauges, or a word cloud.
• Quantitative for a bar chart, a line chart, or a radar chart.
• Table for a table.
3. (If needed) Customize the report display.
4. In the Instant Report, click Save As Report  .
.
.A report displaying the chart (table, radar chart, line chart, bar chart, pie chart, or word cloud) is created.
A Report Template is automatically created, with its Report Table View.
From a Report Table View
You can customize an instant report generated from a Report DataSet as your needs, and save it as a Report Table View so as to reuse it in a Report Template.
Once saved, you can still modify the Report Table View as needed.
To create a Report Template showing a table, a radar chart, a line chart, a bar chart, a pie chart, or a word cloud:
1. Access a Report DataSet.
2. From the Report DataSet, generate the Instant Report type corresponding to the chart type you want to display in the report:
• Breakdown for a pie chart, a bar chart, a set of gauges, or a word cloud.
• Quantitative for a bar chart, a line chart, or a radar chart.
• Table for a table.
3. (If needed) Customize the report display.
4. In the Instant Report, click Save As View  .
.
.A Report Table View is created.
5. You can:
• Create a Report Template using the Report Table View.
• Add the Report Table View to an existing Report Template.
Displaying a Matrix-Bar Chart or a Matrix-Radar Chart
A Report Template can show a matrix associated with its corresponding bar chart or radar chart.
You can create a Report Template showing a matrix-bar chart or a matrix-radar chart:
• from a Report DataSet
• using a Report Matrix View
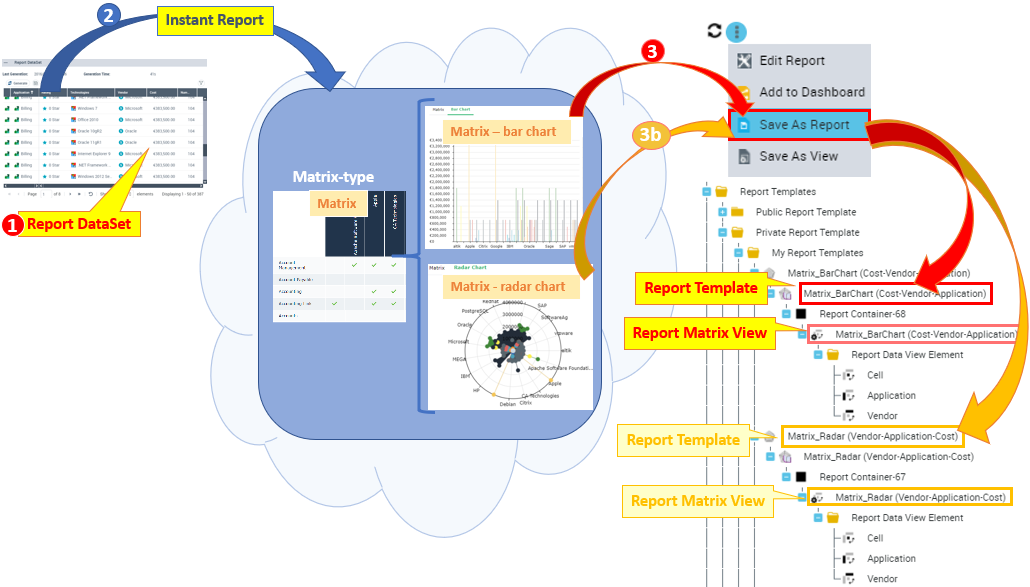
From a Report DataSet
To create a Report Template showing a matrix-bar chart or a matrix-radar chart:
1. Access a Report DataSet.
2. From the Report DataSet, generate a Matrix type Instant Report  .
.
.3. Select the chart type: Bar chart or Radar chart.
4. (If needed) Customize the report display.
5. In the Report section, click More > Save As Report .
.6. Enter a Name to the report.
A report displaying two tabs (the matrix and its associated bar/radar chart) is created.
A Report Template is automatically created, with its Report Matrix View.
From a Report Matrix View
You can customize an instant report generated from a Report DataSet as your needs, and save it as a Report Matrix View so as to reuse it in a Report Template.
Once saved, you can still modify the Report Matrix View as needed.
To create a Report Template showing a matrix-bar chart or a matrix-radar chart:
1. Access a Report DataSet.
2. From the Report DataSet, generate a Matrix type Instant Report .
.3. Select the chart type: Bar chart or Radar chart.
4. (If needed) Customize the report display.
5. In the Report section, click More > Save As View .
.A Report Matrix View is created.
6. You can:
• Create a Report Template using the Report Matrix View.
• Add the Report Matrix View to an existing Report Template.
Displaying a Graph
You can create a Report Template showing a graph:
• from a GraphSet Definition, or
• using a Report Graph View
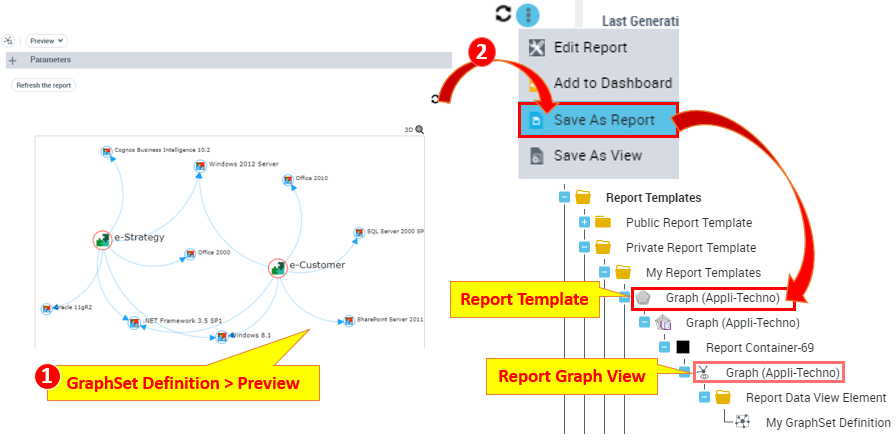
From a GraphSet Definition
To create a Report Template showing a graph:
1. Access a GraphSet Definition.
2. From the GraphSet Definition properties, Preview page, click More > Save As Report .
.A report displaying the graph is created.
A Report Template is automatically created, with its Report Graph View.
From a Report Graph View
You can preview a graph from a GraphSet Definition, and save it as a Report Matrix View so as to reuse it in a Report Template.
To create a Report Template showing a graph:
1. Access a GraphSet Definition.
2. From the GraphSet Definition properties, Preview page, click More > Save As View .
.A Report Graph View is created.
3. You can:
• Create a Report Template using the Report Graph View.
• Add the Report Graph View to an existing Report Template.
Displaying a Gauge
You can create a Report Template showing a gauge:
• from a Query, or
• using a Report Table View
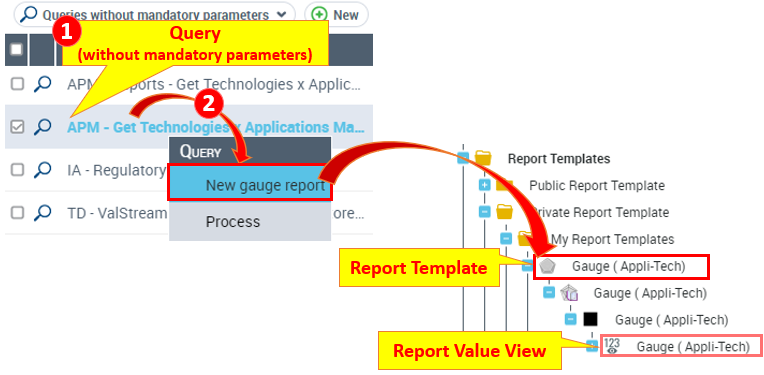
From a Query
To create a Report Template showing a gauge:
1. Access the Queries without mandatory parameters list.
2. Right-click a query and select Documentation > New gauge report.
A report displaying the gauge is created.
A Report Template is automatically created, with its Report Value View.
From a Report Value View
To create a Report Template showing a gauge:
1. Access the Queries without mandatory parameters list.
2. Right-click a query and select Documentation > New gauge report.
A Report Template is automatically created, with its Report Value View.
3. You can:
• Create a Report Template using the Report Value View.
• Add the Report Value View to an existing Report Template.
Displaying a Breakdown, a Dendrogram, a TreeMap, or a TreeTable
You can create a Report Template showing a Breakdown, a Dendrogram, a TreeMap or a TreeTable:
• from a TreeSet Definition, or
• using a Report Tree View
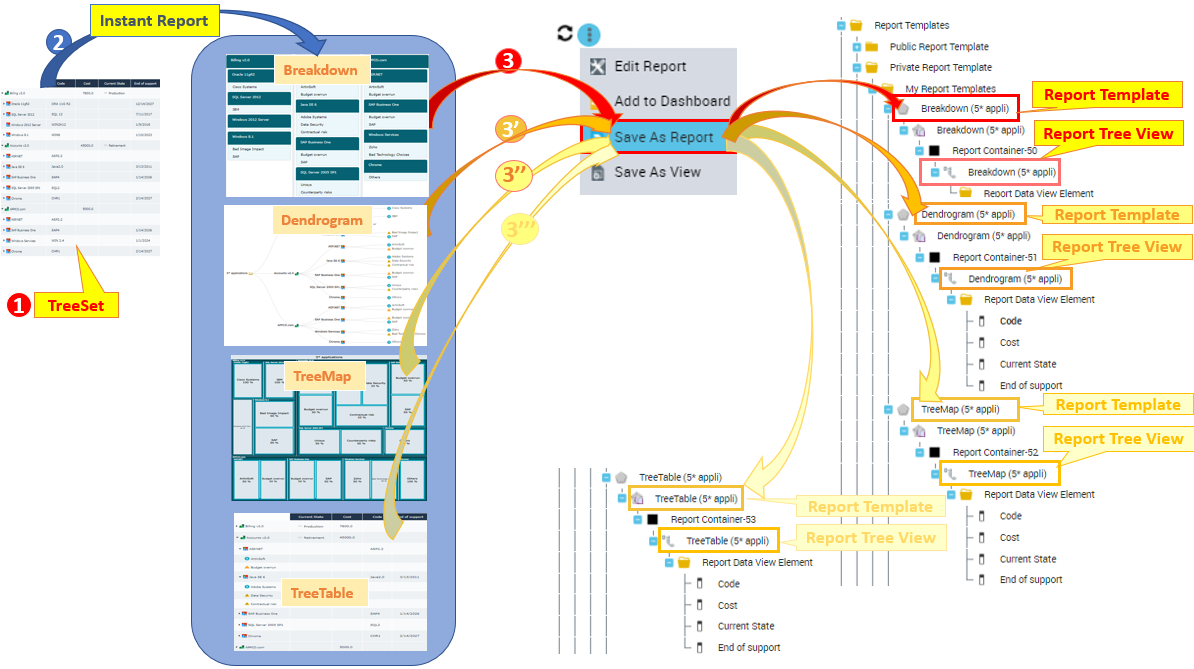
From a TreeSet Definition
To create a Report Template showing a Breakdown, a Dendrogram, a TreeMap, or a TreeTable:
1. Access a TreeSet Definition.
2. From the TreeSet Definition properties, Preview page, click Instant Report and select the rendering type:
E.g.: Breakdown, Dendrogram, TreeMap, or TreeTable.
3. Click More > Save As Report .
.A report displaying the Breakdown map, Dendrogram, TreeMap, or TreeTable is created.
A Report Template is automatically created, with its Report Tree View.
From a Report Tree View
To create a Report Template showing a Breakdown, a Dendrogram, a TreeMap, or a TreeTable:
1. Access a TreeSet Definition.
2. From the TreeSet Definition properties, Preview page, click Instant Report and select the rendering type:
E.g.: Breakdown, Dendrogram, TreeMap, or TreeTable.
3. Click More > Save As View .
.A Report Tree View is created.
4. You can:
• Create a Report Template using the Report Tree View.
• Add the Report Tree View to an existing Report Template.