Project Analysis Reports
Dynamic reports are provided by default for projects; they are used to analyze project content from different angles as well as their impact on the business capabilities and architecture building blocks.
Reports on the Project Content
Embedded reports on a project are visible in the Reports page of the project properties window.
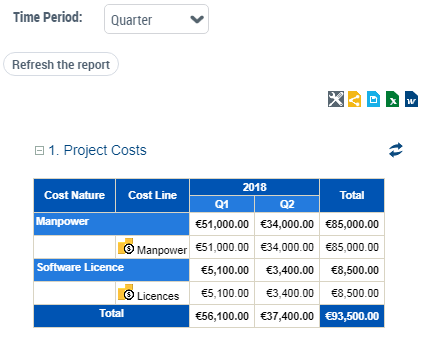
Project Costs
This report details the project costs for a given period and by cost type (labor, infrastructure, etc).
Its input data concerns the costs defined in the project properties (on the Business case page).
It is possible to configure the cost consolidation period via the Time Period parameter; for example a sub-total of project costs is possible per quarter.
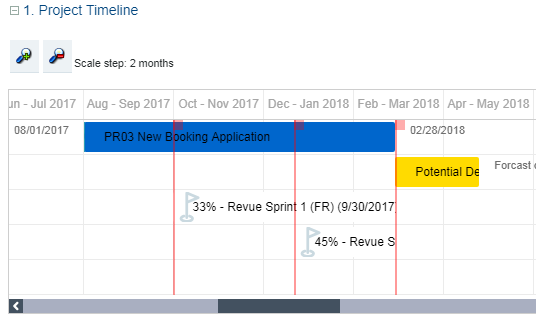
Project and Deliverable Timeline Gantt Chart
This report presents the lifecycle of deliverables in the project schedule.
Its input data concerns the production dates of the deliverables as well as the milestones defined for the project.
The progress of the project and the projected deadlines declared during the follow-up of the execution of the project are also reported on the graph.
See also:
Project KPIs
This report analyses the key indicators of the project. It collects the following data:
• The progress and any delays in the project (defined on the Execution Follow-up page for projects in progress)
• The budget and the costs defined on the project properties (on the Business case page).
• The Return on Investment (calculated)
• Cost variance (calculated)
• The project risks
Progression and delays
Project progression and delays are defined using the last update performed on the project.
Budget and costs
A bar chart presents the following data:
• The planned budget, input manually.
• The total forecast cost, calculated according to the last update of the project (amount spent + remaining to be spent)
• The effective cost, input manually at the end of the project.
For information on project cost input, see Project costs.
Return on investment
A bar chart presents the following data:
• Forecast ROI (as a percentage)
• Effective ROI (as a percentage)
Calculation of the ROI = (profit - budget) / budget.
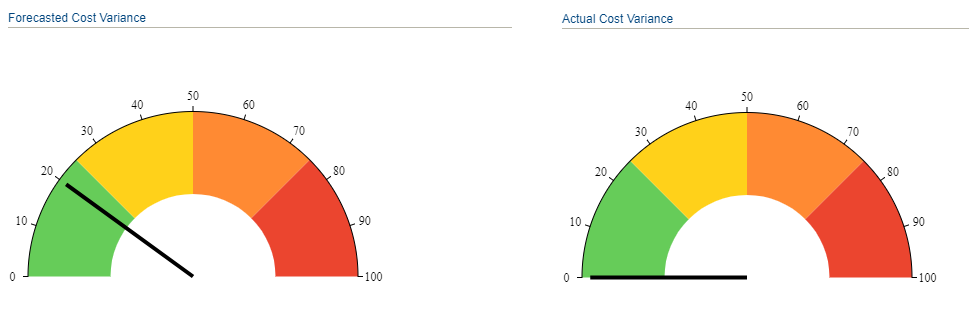
Forecast variance and effective variance
A gauge displays the following data:
• Forecast variance = (total forecast cost - budget) / budget, as a percentage.
• Effective variance = (effective cost - budget) / budget, as a percentage.
Risks
A bar chart displays the risks per risk level (low, high, etc.)
Project summary
This report offers a summary of the characteristics of the project, that is:
• The project charter
• The persons responsible
• The Business case
• The execution follow-up
• The key project indicators.
Architectural Impact Reports for Projects
The Project Portfolio Manager can use reports to analyze the impact of transformation projects on business capabilities or architecture building blocks.
To generate the impact report of transformation projects:
1. Click the Transformation > Projects navigation pane.
2. In the edit area, click the tile that corresponds to the type of report to be generated:
3. Click New.
The report is displayed in the edit area.
4. Open the properties of the report to define its parameters. See below for the parameters specific to each type of report.
5. Once the parameters are set, refresh the report.
Transformation Projects Impact on Capability Map
This report aims to identify, for the business capability map of a given Enterprise phase, the relevant transformation projects and their impact on capabilities, according to the objective of the transformation projects.
This report is available with the HOPEX Business Architecture & Strategic Planning, HOPEX IT Architecture and HOPEX IT Portfolio Management solutions. In the latter case you can select capability maps outside of the enterprise phases which are not available with HOPEX IT Portfolio Management.
Report parameters
The report takes as input:
• A capability map. The list of capability maps included in an enterprise phase is proposed by default.
• A project portfolio.
Filters allow you to customize the display of objects in the report:
• Enable Purpose Type Criterion: you can display or hide the purpose type of the projects. This option is enabled by default, with the form "Fill color": a color highlights the capabilities and projects in the report according to the type of purpose of the projects.
• Capability Filter: you can only display capabilities that are covered by solution building blocks. Criteria also allow you to represent the functionalities associated with capabilities in a specific shape (circle, triangle, etc.).
• Project Filter: you can display only on-going projects. Criteria also allow you to display the assessment levels defined on the projects (business value, cost, etc.).
Report Results
The report presents two chapters:
Transformation Projects Impact on Capability Map
By default, projects are displayed in the relevant capability boxes and highlighted in a color that depends on the type of transformation purpose.
• Innovate -> green
• Improve -> yellow
• Rationalize -> red
Capabilities are highlighted in a color depending on the associated transformation purposes.
• Majority of innovation -> green
• Majority of improvement -> yellow
• Majority of rationalization -> red
Enterprise Stage and Transformation Projects
This chapter displays in a table the projects that are not mapped in the capability map selected at report entry.
They correspond to the following elements:
• projects that produce new capabilities in the "target" capability map
• projects that do not achieve any capability
• projects that achieve capability but are not declared in the enterprise phase.
Transformation Projects Impact on Solutions Landscape
The purpose of this report is to identify, for a given set of solution building blocks (e.g. application systems environment, resource architecture environment), the relevant transformation projects and their impact on the building blocks, based on the deliverables of the transformation projects.
This report is available only with the solutions HOPEX Business Architecture & Strategic Planning and HOPEX IT Architecture.
Report parameters
The report takes as input:
• A solution landscape: application system environment, resource architecture environment, etc.
• A project portfolio.
Filters allow you to customize the display of objects in the report:
• Enable Impact Type Criterion: you can display or hide the impact type of the project deliverables (enabled by default).
• Solution Landscape Filter: you can display only applications in production.
• Project Filter: you can display only on-going projects. Criteria also allow you to display the assessment levels defined on the projects (business value, cost, etc.).
Report Results
The report presents two chapters:
Transformation Projects Impact on Solutions Landscape
By default, projects are displayed in the relevant solution building blocks and highlighted in a color that depends on the impact type of the deliverables provided.
• New: in green
• Updated: in yellow
• Deleted: in red
Each solution block is highlighted in a color based on the average impact type of the deliverables within the project.
• If the majority of the deliverables are 'new' - > green
• If the majority of the deliverables are 'updated' (or not defined) - > yellow
• If the majority of the deliverables are 'deleted' - > red
Project Deliverables
This chapter displays in a table the projects that deliver new solution building blocks, not listed in the solution landscape selected at report entry.
Transformation Projects & Deliverables Impact on Capability Map
This report aims to identify, for the business capability map of a given Enterprise phase, the relevant transformation projects and their impact on capabilities, according to the deliverables of the transformation projects.
This report is available with the HOPEX Business Architecture & Strategic Planning (Business Architect profile), HOPEX IT Architecture and HOPEX IT Portfolio Management solutions. In the latter case you can select a solution landscape outside of the enterprise phases which are not available with HOPEX IT Portfolio Management.
Report parameters
The report takes as input:
• a capability map
• a project portfolio
Filters allow you to customize the display of objects in the report:
• Enable Impact Type Criterion: you can display or hide the impact type of the project deliverables (enabled by default).
• Capability Filter: you can only display capabilities that are covered by solution building blocks. Criteria also allow you to represent the functionalities associated with capabilities in a specific shape (circle, triangle, etc.).
• Project Filter: you can display only on-going projects. Criteria also allow you to display the assessment levels defined on the projects (business value, cost, etc.).
Report Results
The report presents two chapters:
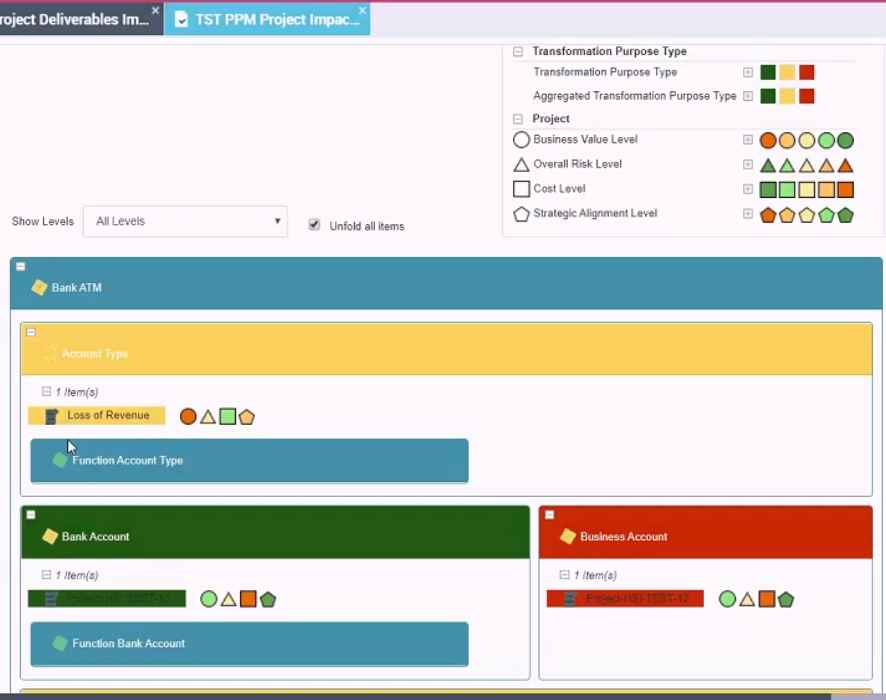
Impact of project deliverables on the capacity map. This chapter displays the capacity map and the impact of project deliverables on these capacities.
By default, within each capability, projects and delivered building blocks (e.g. applications) are identified as "new", "updated" or "deleted". Project deliverables are listed and highlighted by color coding based on the type of impact of the deliverable.
• New: in green
• Updated: in yellow
• Deleted: in red
Each solution block is highlighted in a color based on the average impact type of the project deliverables.
• If the majority of the deliverables are 'new' - > green
• If the majority of the deliverables are 'updated' (or not defined) - > yellow
• If the majority of the deliverables are 'deleted' - > red
Project Deliverables
This chapter displays in a table the deliverables that are not listed in the capability map. They correspond to the following elements:
• Solution building blocks that produce new capabilities in the "target" capability map
• Building blocks that do not achieve any capability
• Building blocks that achieve capability but are not declared in the enterprise phase.
Transformation Projects & Deliverables Impact on Solutions Landscape
This report is available only with the solutions HOPEX Business Architecture & Strategic Planning and HOPEX IT Architecture.
It aims to identify the impacts of transformation projects on a solution landscape or capability map.
• For a given solution landscape (e.g. application system environment, resource architecture environment): the report identifies relevant transformation projects and their impact on the solution building blocks, according to project deliverables.
• For a given business capability map: the report identifies relevant transformation projects and their impact on capabilities, based on transformation project deliverables.
Report parameters
The report takes as input:
• a solution landscape or a capability map
• a project portfolio
Filters allow you to customize the display of objects in the report:
• Enable Impact Type Criterion: you can display or hide the impact type of the project deliverables (enabled by default).
• Solution Landscape Filter: you can display only applications in production.
• Capability Filter: you can only display capabilities that are covered by solution building blocks. Criteria also allow you to represent the functionalities associated with capabilities in a specific shape (circle, triangle, etc.).
• Project Filter: you can display only on-going projects. Criteria also allow you to display the assessment levels defined on the projects (business value, cost, etc.).
Report Results
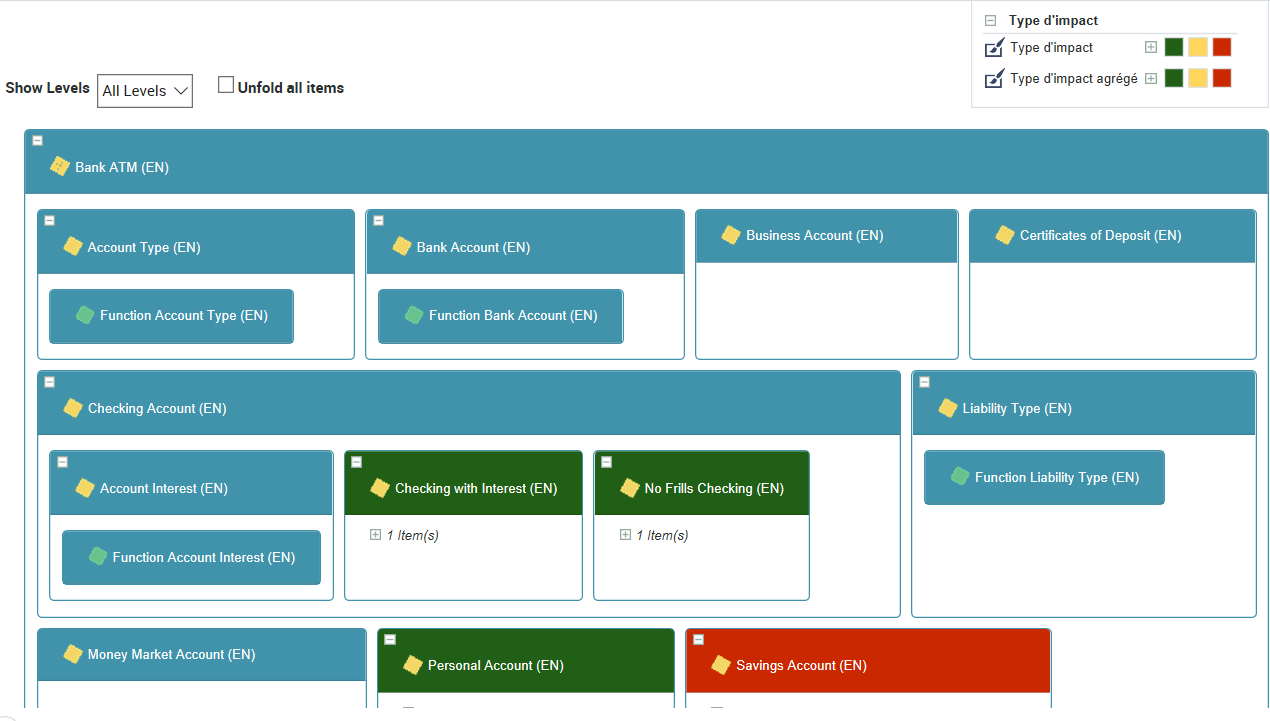
Solution Landscape Project Coverage Heat Map
This map shows the selected solution landscape and the impact of project deliverables on the solution building blocks.
Projects are displayed in the relevant solution building blocks and highlighted in a color that depends on the impact type of the deliverables provided.
• New: in green
• Updated: in yellow
• Deleted: in red
Each solution block is highlighted in a color based on the average impact type of the deliverables within the project.
• If the majority of the deliverables are 'new' - > green
• If the majority of the deliverables are 'updated' (or not defined) - > yellow
• If the majority of the deliverables are 'deleted' - > red
Following this map a table lists the projects that deliver solution building blocks not listed in the landscape selected at report entry.
Capability Map Coverage Heat Map
This chapter displays the capability map and the impact of project deliverables on those capabilities.
Within each capability, projects and delivered building blocks (e.g. applications) are identified as "new", "updated" or "deleted". Project deliverables are listed and highlighted by color coding based on the type of impact of the deliverable.
• New: in green
• Updated: in yellow
• Deleted: in red
Each solution block is highlighted in a color based on the average impact type of the project deliverables.
• If the majority of the deliverables are 'new' - > green
• If the majority of the deliverables are 'updated' (or not defined) - > yellow
• If the majority of the deliverables are 'deleted' - > red
Following this map a table lists the new building blocks that are not listed in the capability map of the report.