Functional Data Lineage
Functional data lineage is a way of specifying, defining or viewing data lineage without the technical information that the business user does not need.
To specify or consult a functional data lineage, data managers have a diagram in which they can draw the various processes and transformations that apply to the data independently of their implementation. They can thus specify:
• Where the data is located and how it is stored in an environment, for example on a site or in a data store.
• By which processes and systems the data is used, and with which access rights.
• Who is responsible for updating the data.
• Etc.
An analysis report shows the dependencies that exist between enterprise data.
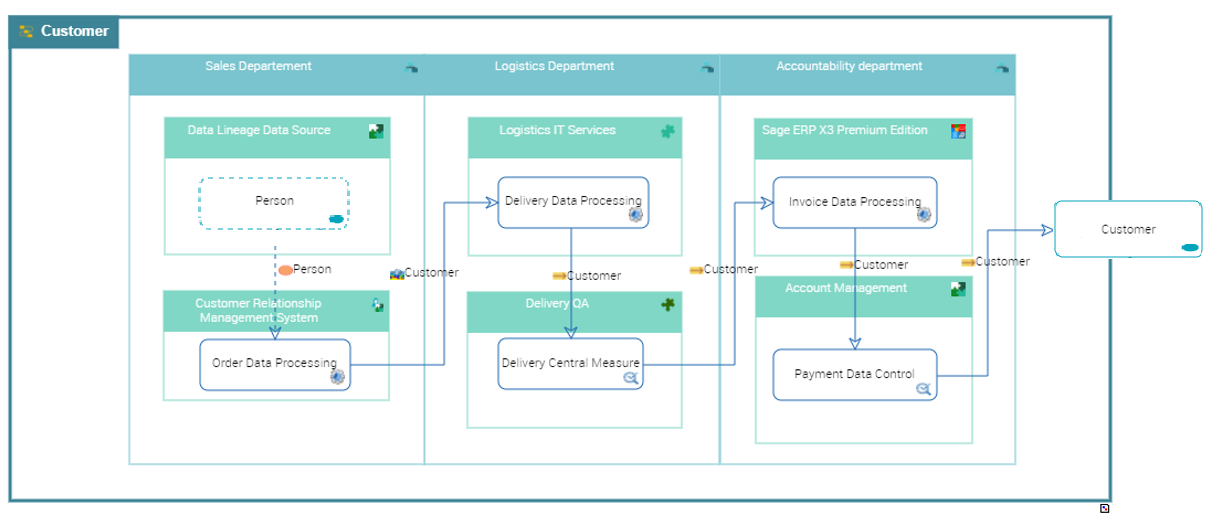
Example of Lineage of a Business Data
Below is an example of the lineage of the "Customer" concept: the lineage presents the path of the data, with the participating departments (Sales, Logistics, Accountability), the treatments performed and by which applications or technologies.
Creating a Functional Data Lineage and its Diagram
You can create a data lineage on a concept, a class or a table.
To create a data lineage in HOPEX Data Governance:
1. Open the properties of the object (concept, class or table).
2. Click the Characteristics page.
3. On the right of the page, under the Data lineage field, click the New button.
4. Select the type of diagram.
Example: a physical data lineage diagram for a table.
The Initialize diagram option is checked by default. See Initialisation of the diagram below.
5. Click OK.
6. Select the relevant object and click Next.
The data lineage diagram opens.
Initialisation of the diagram
When the data described by the lineage is used in content that exists or is associated with calculation rules, the Initialize the Diagram option appears; it is used to initialize the diagram with the content and rules in question.
More precisely, initialization is based on:
• the content that carries the data item in the exchange flows between the software (applications, Application Systems, etc.), described in the flow scenarios.
• Scenario software is used to initialize the data sources in the lineage. Flow transition, its reception and its direction in the scenario enable initialization of data processing, its transitions and directions.
• When the tasks performed by the software of a scenario are detailed in an application process for example, they also appear in the lineage processing nodes.
• the calculation rules available for this data item. The information defined as input parameters of these rules initialize the original nodes of the lineage.
Data lineage workflow
When creating a data lineage (business, logical or physical), the first transition of the workflow -"In design" - is automatically created.
For more details on the workflow, see Data Validation Workflow.
Objects of the Data Lineage Diagram
The toolbar on the left of the diagram shows the objects you can insert into the diagram. Some, such as Org-Units, can be connected. Other objects, such as Applications or Application services, can also be created.
Participant
A participant is used to define where a processing takes place. This can be an org-unit or a position.
Adding a participant
You can add an existing org-unit or position to the diagram
To add an existing org-unit:
1. In the object insertion bar, click the Org-Unit icon and then in the diagram.
2. In the window that appears, enter the name of the org-unit.
3. Select the org-unit that appears in the list.
4. Click OK.
Origin business data
This is the input data of the data lineage.
Data flow
The data flows represent the transitions between the data lineage steps, through which the input and output data are provided.
Concept property rule
A concept property rule is the collection and handling of data elements to produce significant information.
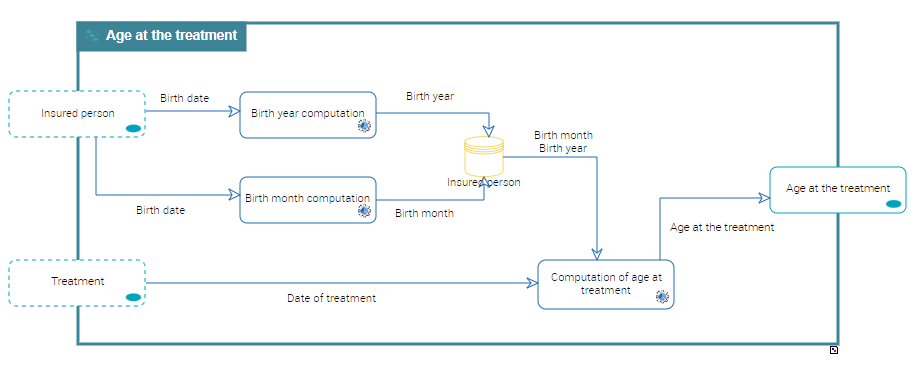
In the example below, the concept property rule "Computation of age at treatment" is used to calculate the age of the patient at the time of treatment. The rule takes as parameters:
- the month and year of birth available in the "Insured Person" concept store and deduced from the properties of the "Insured Person" concept.
- the date of the treatment, taken from the "Treatment" concept.
Creating a concept property rule
In the example above, to define the rule that calculates the age of the insured person at the time of treatment, you must:
• Create a concept property rule
• Create the flows between the information sources and the concept property rule
• Specify on the flows the information transmitted
• Specify on the rule the input and output information
To do this:
1. In the object insertion bar, click Concept Property Rule.
2. Click in the diagram.
3. Specify the name of the rule ("Computation of age at treatment") and click Next.
The rule appears in the diagram.
4. Click the Data Flow icon and create a data flow between the "Insured Person" lineage concept store and the concept property rule.
5. Select the data flow and click the Properties button.
6. Click the Characteristics page.
7. Under the Owned Data Property Lineage section, add the properties "Birth month" and "Birth year".
8. Create a second flow between the "Treatment" Concept and the concept property rule.
9. On this flow add the property "Date of treatment".
10. Select the concept property rule to display its Properties.
11. Click the Characteristics page.
12. Under the Parameters section, select :
• the rule's input parameters: "Birth month", "Birth year" and "Date of Treatment".
• the output parameter of the rule: "Age at the treatment".
Data quality measure
A data quality measurement checks that the data issued by a process is compliant with the quality requirements. It is therefore used to prevent risks (erroneous or missing data for example) linked to data calculation or processing.
Adding a data quality measure
In the lineage diagram you can connect existing measures. To do this:
1. In the object insertion bar, click the Data Quality Measure icon.
2. Click the diagram.
3. In the window that appears, enter the name or the first letters of the name of the data quality measure.
The corresponding quality measure appears in the drop-down list.
4. Select it.
5. Click OK.
To access all data quality measurements, click the navigation menu then Compliance > Operational Assurance > Data Lineages > Quality Measurement Inventory.
Processing software
These are software systems that perform data processing. You can select one of the following elements as a software source:
• Application System
• Application
• Micro-service
• IT dept
You also display the traceability of data use at the software level. The software system can be under the responsibility of an org-unit or a type of position.
You can define the following in the software system:
• data stores (data areas) that contain the saved information (original data, data flows, etc.), the CRUD defined.
• software components that access the data store
• application processes where the data is processed
Adding a processing software
You can add an existing software to the diagram or create a new one.
To create an application in the diagram for example:
1. In the object insertion bar, click the Application icon and then in the diagram.
2. In the window that appears, enter the name of the application.
3. Click Next.
4. Indicate its owner.
5. Click OK.
The application appears in the diagram.
Technology
The technologies represent the components required for the operation of software (servers, operating systems, etc.) that are part of the data lifecycle.