Planning tests using a Gantt chart
A report allows the compliance manager to plan the different tests of a test plan.
Displaying the Gantt chart
To display this report:
1. Under Compliance Testing > Plans, select the plan in question.
The plan properties appear in the edit area.
2. In its properties select the Schedule tab.
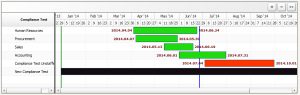
A Gantt chart describes tests of the test plan.
By default, planning relates to the current year, but you can view audits over a more precise period.
You can redefine the Gantt chart display period:
• by selecting a calendar period.
• or specific begin and end dates.
You can modify audit dates in the diagram:
• by moving the period begin or end dates using the mouse.
• by clicking the center of the period and by moving the mouse to simultaneously move the begin and end dates.
Zoom and reframing functions at the right of the chart allow you to customize display.
 Zoom in on calendar
 Zoom out
 Reframing
Adding a test from the Gantt chart
You can add compliance tests from this chart.
1. In the Planning tab of the plan properties dialog box, click Add a compliance test.
2. Click the Save button.
The compliance test appears in black as begin and end dates have not been specified yet.
To plan a newly-created compliance test:
• begin date
• end date
The test appears in red: you must assign auditors. For more details, see Assigning a resource to a test.
Vertical line color | Meaning |
|---|---|
Green | Beginning of test |
Red | End of test |
Blue | Current date |
Gantt chart vertical line colors