Repository Performance and Health
Consulting RDBMS Repository Performance
Before you start working in an RDBMS repository, MEGA recommends that you run the RDBMS diagnostic utility ("Measure performance of your SQL data source").
This utility indicates repository performance compared to optimized performance. For this purpose, you can run the utility from HOPEX Administration.
To run the RDBMS repository diagnostic utility:
1. Connect to HOPEX Administration and select the repository concerned.
2. Right-click the RDBMS repository concerned and select RDBMS Administration > Measure performance of your SQL data source.
3. (If necessary) Enter the connexion parameters.
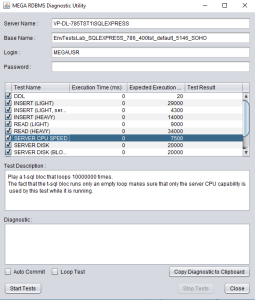
4. Click Start Tests.
5. Run the test twice before analyzing data.
Generating a Repository Health Report
With HOPEX you can daily generate an RDBMS repository health report. This report enables to detect:
• performance or usage anomalies that users can face daily.
• any significant change.
For this purpose, performance and health tests are run daily. Events are generated when anomalies are detected
Performance test description
HOPEX standard use scenario are performed daily in the afternoon ("RepositoryHeath Daily Afternoon Trigger” job, 04:00 pm GMT):
• Reading of comments on read-only data (“Reading of”).
• Read-only data loading.
• Request execution on read-only data.
• Comment writing on reading and writing data.
• Data creation.
• Data deletion.
• Search request execution on reading and writing data.
Each scenario generates a result, which is stored in the repository. These results are analyzed daily in the evening ("RepositoryHeath Daily Evening Post Trigger” job, 11:05 pm GMT)
An history of 36 results are needed before generating an alert.
Health test description
It is essential to analyze certain usages to identify anything that might compromise data integrity, whether in the daily work or following a HOPEX update.
For all of the repositories of all of the environments, the following checks are performed every evening ("RepositoryHeath Daily Evening Trigger” job, 11:00 pm):
• Administration
• SQL compatibility of repositories and server
• table fragmentation
• index fragmentation
• SQL maintenance plan execution
• Customization
• HOPEX data modification
• HOPEX data volume
• Usage
• workspace volume
Health report description
The health report includes a short description of the anomaly detected at performance or usage level.
For example, in case of an index fragmentation anomaly:
Sent from: <Name of the machine that ran the report formatting and emailing task>
Environment: <Environment name>
Repository: <Repository name>
Table A_BLOB
Index GBM_INDEX_A_BLOB_IDABS_BEGIN_VALIDITY
Fragmentation level 70%
Configuring HOPEX for emailing the report
You can receive a short report of all of the anomalies detected on an environment repository.
The health report is daily sent by email:
• You must define the list of recipients of the report.
• If mailing configuration parameters are not configured (Specifying SMTP configuration) you must configure the mailing permissions at site level.
To configure the email:
1. Access the megasite.ini file (<HOPEX installation folder>\cfg).
2. In the megasite.ini file, [General] section, define the key corresponding to the report recipient list:
[General]
RepositoryHealthAlert=me@domain.com,you@domain.com
3. In the megasite.ini file, add a [Mail] section and define the keys corresponding to:
• the server url
• the port
• the email address of the user (person or system) who must have rights to send emails:
[mail]
SMTPServer=mail.server.domain.com
SMTPPort=25
SMTPDefaultSendingAddress=admin@domain.com