Using HOPEX Supervision data
From each HOPEX Supervision console page you can:
• customize the data display
• access prefiltered lists
From these prefiltered list you can:
• add filters
• create graphs
Customizing the view display
You can customize the data display:
• sort the data
• display only the indicators you are interested in
To customize the view display:
1. Access the HOPEX Supervision console.
2. Display the data view you want to supervise.
Data is displayed in a table format.
3. You can:
• click a header arrow > Sort Ascending or Sort Descending.
For example in the Events page, in the event count, select Sort Descending to display the most frequent events at the top.

• click a header to sort the data according to a specific indicator.
For example in the Events page, click event type to sort the events by type.
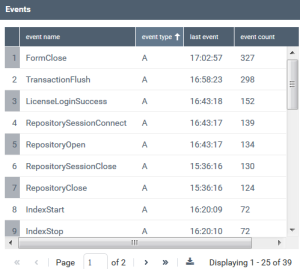
• click a header arrow > Columns and select the indicators you want to be displayed only.
Accessing prefiltered lists
From Computers, Processes, Users, Sessions, Events, Macros pages, you can access prefiltered lists.
To access prefiltered lists:
1. Access the HOPEX Supervision console.
2. Display the supervision page you are interested in.
The supervision events are displayed in a table.
3. Click the row of the event you are interested in.
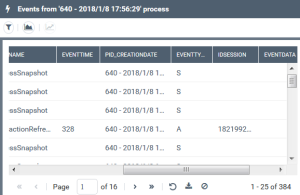
All the events corresponding to the selected row are listed chronologically in a table.
For example in the Events page, click the "MacroExcessiveInvocationTime" event. All of the "MacroExcessiveInvocationTime" events that occured are displayed.
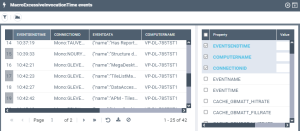
4. (If needed) In the right pane select the indicators you want to display as columns in the supervision event list.
5. (If needed) You can:
• filter the event display
• graph the event count by time interval
• graph an event
• (Computers view specific) graph the CPU
Adding filters to the event list
For a better focus on the information you can add filters to the event list. You can add filters on any of the indicators.
To add filters to the event list:
1. Access the prefiltered list.
2. Click Filters  .
.
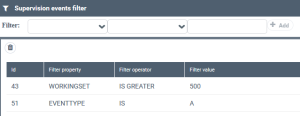
.The Supervision events filter window is displayed.
3. Configure your filter:
• in the first drop down list, select the indicators (Filter property)
• in the second drop down list, select the operator (Filter operator)
• in the field enter the value
4. Click Add.
The filter is added in the filter list with a specific Id.
You cannot modify a filter, you can delete it only.
 .
.5. Close the window.
Events are filtered according to the added filters.

6. (if needed) Click  to export the filtered view in a .txt format.
to export the filtered view in a .txt format.Deleting all the filters added to the event list
To delete all the filters added to the event list:
1. Access a prefiltered event list.
2. At the bottom of the list, click Clear all filters  .
.
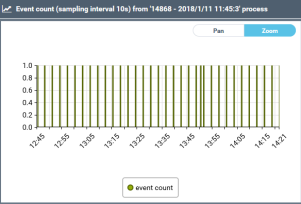
.Graphing an event count by time interval
For another display of the information you can graph the event count that occurred by a defined time interval (seconds).
To graph the event count by time interval:
1. Access a prefiltered event list.
2. Click Graph events count by time  .
.
.The Enter the sampling interval value dialog box is displayed.
3. Enter a value (in seconds) to define the sampling interval value.
4. Click Ok.
The event number that occurred by the defined time interval is graphed (step line format).
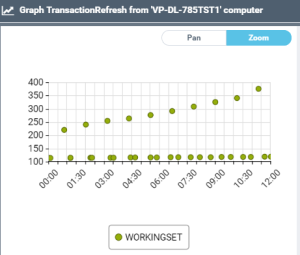
Graphing an event
For another display of the information you can graph an event.
To graph an event:
1. Access a prefiltered event list.
2. Select the row corresponding to the event (Eventname) you want to graph.
3. Click Show graph for <eventname> events  .
.
.Example: graph for an A-type event (TransactionRefresh)
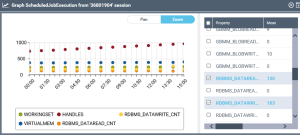
Example: graph for an S-type event (ProcessSnapshot)

Graphing the server CPU
To graph the server CPU:
1. From the Computers page, access a prefiltered event list.
2. Click Graph CPU from <server name> computer  .
.
.
Handling a graph
You can:
• add other indicators to the graph
• zoom in the graph
• move within the graph
To add indicators to the graph:
1. From a prefiltered list, create a graph.
2. In the graph window, in the right pane, select the indicators you want to add to the graph.
The selected indicators are:
• added to the graph with a specific color for each indicator, and the graph scale is automatically fitted.
• highlighted in bold blue in the right pane.
To zoom in the graph:
1. Create a graph.
2. In the graph window, click Zoom.
3. Click in the graph, keep your finger on the mouse and drag it to the right to zoom in.
To move within the graph
1. Create a graph.
2. In the graph window, click Pan.
3. Click in the graph, keep your finger on the mouse and drag it to the right or left. to move to the right or left
To view an indicator information:
1. Create a graph.
2. Click the data in the graph.
The indicator value is detailed and when it occurred.
