Reports available on the projects
Dynamic reports are provided by default for projects; they are used to analyze project content from different angles.
Embedded reports for projects are visible in the Reports page of the project properties window.
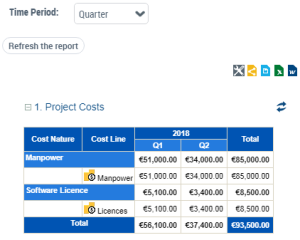
Project Costs
This report details the project costs for a given period and by cost type (labor, infrastructure, etc).
Its input data concerns the costs defined in the project properties (on the Business case page).
It is possible to configure the cost consolidation period via the Time Period parameter; for example a sub-total of project costs is possible per quarter.
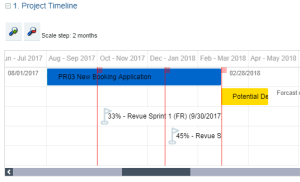
Project and Deliverable Timeline Gantt Chart
This report presents the lifecycle of deliverables in the project schedule.
Its input data concerns the production dates of the deliverables as well as the milestones defined for the project.
The progress of the project and the projected deadlines declared during the follow-up of the execution of the project are also reported on the graph.
See also:
Project KPIs
This report analyses the key indicators of the project. It collects the following data:
• The progress and any delays in the project (defined on the Execution Follow-up page for projects in progress)
• The budget and the costs defined on the project properties (on the Business case page).
• The Return on Investment (calculated)
• Cost variance (calculated)
• The project risks
Progression and delays
Project progression and delays are defined using the last update performed on the project.
Budget and costs
A bar chart presents the following data:
• The planned budget, input manually.
• The total forecast cost, calculated according to the last update of the project (amount spent + remaining to be spent)
• The effective cost, input manually at the end of the project.
For information on project cost input, see Project costs.
Return on investment
A bar chart presents the following data:
• Forecast ROI (as a percentage)
• Effective ROI (as a percentage)
Calculation of the ROI = (profit - budget) / budget.
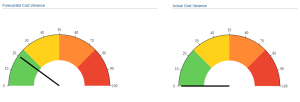
Forecast variance and effective variance
A gauge displays the following data:
• Forecast variance = (total forecast cost - budget) / budget, as a percentage.
• Effective variance = (effective cost - budget) / budget, as a percentage.
Risks
A bar chart displays the risks per risk level (low, high, etc.)
Project summary
This report offers a summary of the characteristics of the project, that is:
• The project charter
• The persons responsible
• The Business case
• The execution follow-up
• The key project indicators.