Consulting Decision-Making Reports
In HOPEX GDPR you may use your dashboard to identify compliance priorities and perform an initial assessment. It will enable you to focus on the activities at risk whose compliance needs to be improved.
Your dashboard is prepopulated with 3 different charts in the form of a pie chart. They give an indication of:
• the final compliance level and risk scale after assessment of the processing activity.
• which processing activities have already been assessed through a DPIA
Accessing your dashboard
To access your dashboard:
Processing activities by compliance level
This pie chart enables you to view which processing activities are compliant.

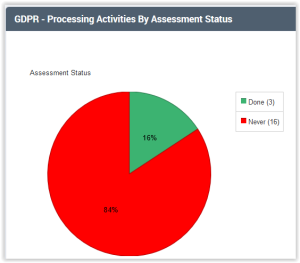
Processing activities by assessment status (DPIA)
This pie chart illustrates the number of processing activities which have been assessed through a DPIA. Those which have not been assessed through a DPIA require your attention.
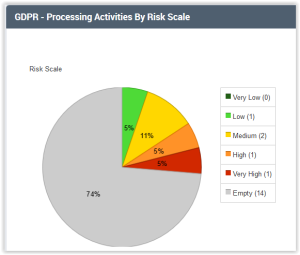
Processing activities by risk scale
This pie chart shows which processing activities are considered at risk.