Launching an Instant Report
You can launch a report:
• from a list of objects
E.g. : a list available in a tile on your home page, in a search result, or in the result of an analysis report when the latter allows this.
• from a Report DataSet
Launching an instant report from a List
To launch an instant report:
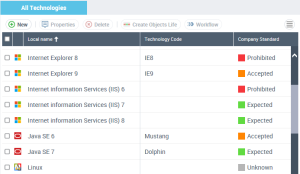
1. Display the relevant object list.
E.g. : in your home page, from the All technologies tile, display the list of all technologies.
2. (optional) By default the instant report is launched on all the objects included in the list. Select the objects concerned to restrict the instant report to the selected objects.
3. Click
Instant Report 
.

If the button is hidden, click

to access it.
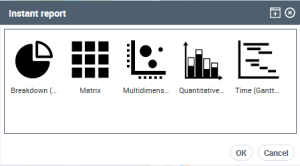
4. Select the required instant report.
You can create different types of instant reports: matrix, multidimensional, quantitative (bar chart), as well as breakdown-type instant reports in the form of a pie chart or bar chart and time-type instant reports.
Example: breakdown (pie chart, bar chart)
5. Click OK.
The instant report is displayed in the View edit area.
6. Depending on the type of instant report selected, you can enter the parameter information for the instant report.
For example, for an instant report:
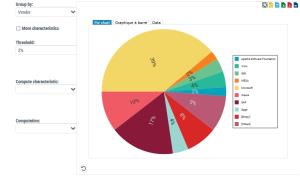
• of breakdown type, in the Group by field, you can select a grouping characteristic from the list of attributes offered.
• of quantitative type (bar chart), you can select information to be taken into account in the graphic display.
Objects are automatically displayed according to the selected grouping.
Example: "Provider".
For all selected technologies, you get their breakdown according to their Vendor.
Launching an instant report from a Report DataSet
To generate an instant report from the Report DataSet :
1. Access the Report DataSet properties.
2. In HOPEX:
• Web Front-End: from the drop-down menu, select Data.
• Windows Front-End: select the Data tab.
3. (If necessary) In the Parameters section, click Connect and select the input parameters.
E.g.: with a Report DataSet that has the "Application Technologies" definition, you can add applications.
4. In the
Report DataSet section, click
Refresh 
.
5. In the
Report DataSet section, click
Instant Report .
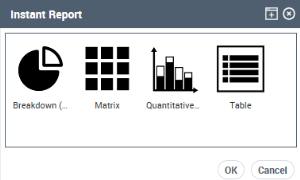
6. Select the required instant report.
You can create different types of instant reports; matrix, quantitative (bar chart), breakdown-type instant reports in the form of a pie chart or bar chart or table-type instant reports.
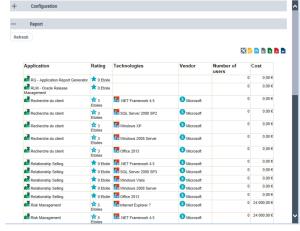
Example: Table
7. Click OK.
The instant report is displayed in the View edit area, Report section.
It contains as many rows as objects and as many columns as object characteristics.
8. (Optional) You can customize the table to obtain a more precise description of the result and facilitate the analysis. For this, in the Configuration section, add one or as many filters as necessary to the input characteristics of the report.