Viewing Application Life (Gantt Chart)
An object evolving over time can take different states (preparation, production, retirement, etc.).
The Object life enables viewing of the planning of these different states in the form of a Gantt chart.
To view the Gantt chart representing the different states of an application for example:
1. Open the application properties.
2. In the properties of the application, click the drop-down list and select Characteristics.
3. Expand the Gantt section.
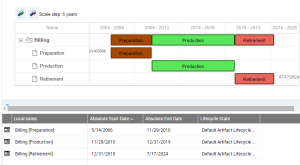
Gantt chart example
The first line shows the synthesis of the life cycle of the application (here "Billing"), with the sequence of different states. Under this line you access the details of the time periods associated with each state (preparation, production, etc.).
Gantt Chart Report