Launching an Instant Report
You launch an instant report from an object list.
To generate an instant report:
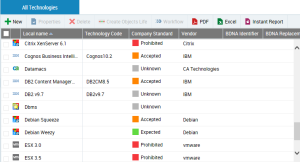
1. Display the relevant object list.
Example: All Technologies
2. Click
Instant Report 
.
3. Select the required instant report.
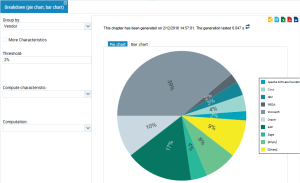
Example: breakdown (pie chart, bar chart)
4. Click OK.
5. Select a Grouping Characteristic from the list of attributes proposed.
Objects are displayed according to the selected grouping.
Example: "Provider".
For all selected applications, you get their breakdown according to their provider.
Updating an instant report
When an instant report has already been launched, its data is stored in the cache. A message (at the top of the report) specifies the date of the last generation of the instant report as well the time required for generation. If the data contained in the list of objects changes, you must refresh the instant report to take these changes into account.
When the instant report is updated, the generation date message for the instant report is not displayed.
To update an instant report:

Click on the update button

beside the generation date information of the instant report.
Getting the object list of a data series
To get the list of objects making up part of the chart:
Click the chart part concerned.
The list of objects included in this part is displayed.

From this list you can generate new instant reports.
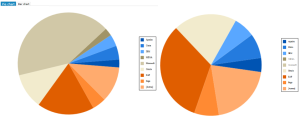
Masking a data series
For improved visibility, you can mask data series in the report graphic.
This feature is available with
MEGA (MEGA Web Front-End) only.
To mask/display a data series:
1. In the report key, click the data series in question. In the key, the series name is grayed.
The series is not display anymore in the chart.
You can mask several series.
2. In the key, click the series again to reintegrate it in the report.