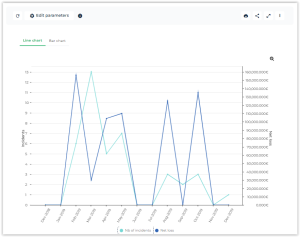
Incident and Loss Evolution by Month
This report displays monthly distribution of incidents and monthly distribution of losses on two different diagrams.
 For more details on how to connect an incident to a loss, see Entering Losses.
Access path
Navigation bar > Reports
Report parameters
This consists of selecting incidents and losses that will be presented by specifying elements that define their scope: risk types, entities, processes or business lines.
|
Parameters
|
Parameter type
|
Constraints
|
|---|---|---|
|
Currency
|
Currency
|
Currency of reports. Local currency is used by default.
|
|
Threshold
|
Real
|
Minimum amount of displayed losses.
|
|
Begin Date
|
Date
|
One year before current date by default.
|
|
End date
|
Date
|
Current date by default.
|
|
Risk Type
|
Risk Type
|
Selection of incidents connected to risk types of list or to their sub-risk types. Not mandatory.
|
|
Process
|
Process
|
Selection of incidents connected to processes of list or to their sub-processes. Not mandatory.
|
|
Process category
|
Process
category |
Selection of incidents connected to process categories of the list or to their sub-categories. Not mandatory.
|
|
Entities
|
Entity
|
Selection of incidents connected to entities of list or to their sub-entities. Not mandatory.
|
|
Business lines
|
Business lines
|
Selection of incidents connected to business lines of list or to their sub-business lines. Not mandatory.
|
Results
This report displays the number of incidents and the corresponding net loss (sum of losses - sum of recoveries) per month between two dates.
If no parameter is defined, all incidents are taken into account. Otherwise, only the incidents connected to the objects specified as a parameter and their children (risk types, process categories, processes, entities and business lines) are displayed.